A Look at the First Three Weeks of Cboe Bitcoin Futures Trading
By Cboe
On December 11, 2017 Cboe Global Markets was the first exchange in the world to list futures based on bitcoin price levels. As of the end of 2017 we have three weeks of trading activity to look at and so far the price action has been interesting. We have experienced backwardation and contango with the relative pricing as well as seeing the distribution of volume and open interest being weighted toward the front month (January) contract.
First, let’s take a look at the bitcoin term structure. When the spot market is higher than the futures we tend to refer to the shape of the curve as being in backwardation. When a spot market is lower than the futures pricing the curve is referred to as being in contango. Below are the closing Cboe Bitcoin Futures pricing along with the Gemini 4 pm Eastern auction pricing each day for the first week of trading.
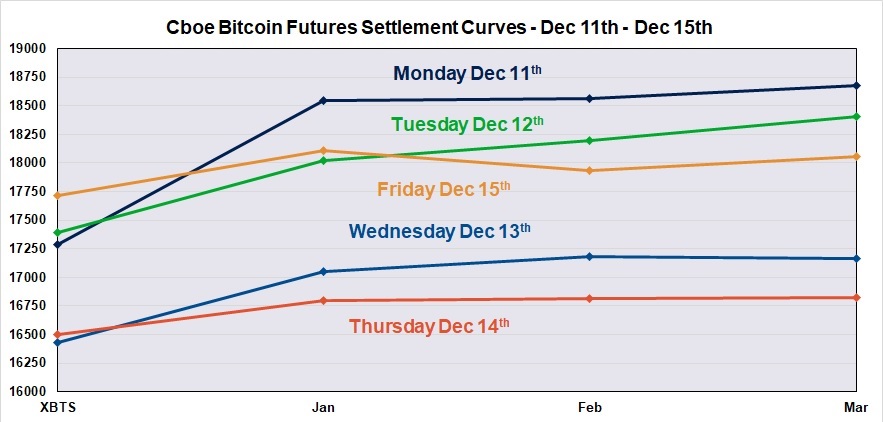
Note the steepness of the curve on the first day of trading. The Gemini Auction price that day was $17,285.89 while the January future settlement prices as $18,545.00. This represents spot at a 7.2% discount to futures. This steepness went away as more market participants became involved in futures trading and volume picked up a bit.
The second week curves appear below. Note the steepness of the first trading day from the previous chart was never repeated.
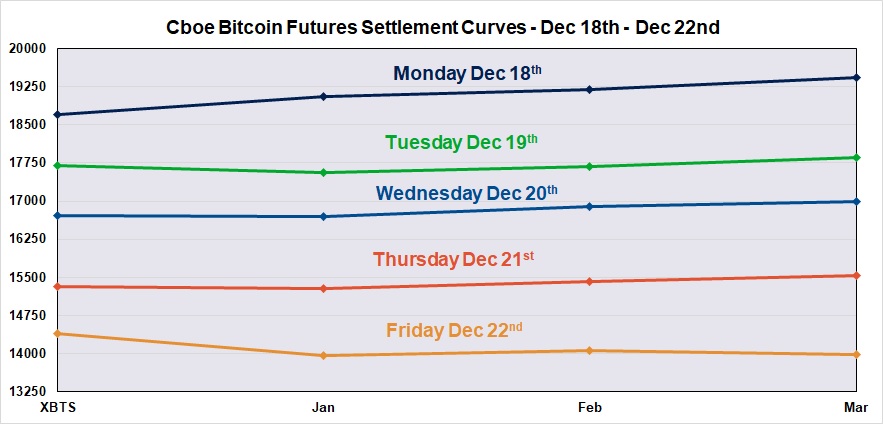
In addition to a flattening of the pricing structure, during the week of December 18th to December 22nd there were a couple of days where the Gemini Auction price was at a premium to the January future. This represents the first cases of backwardation. On Tuesday December 19th, the US Gemini Auction settlement price was $17,700.00 while the January contract closed at $17,555.00. Also, on Friday that week the Gemini Auction price was $14,400.00 while the January contract closed at $13,960.00.
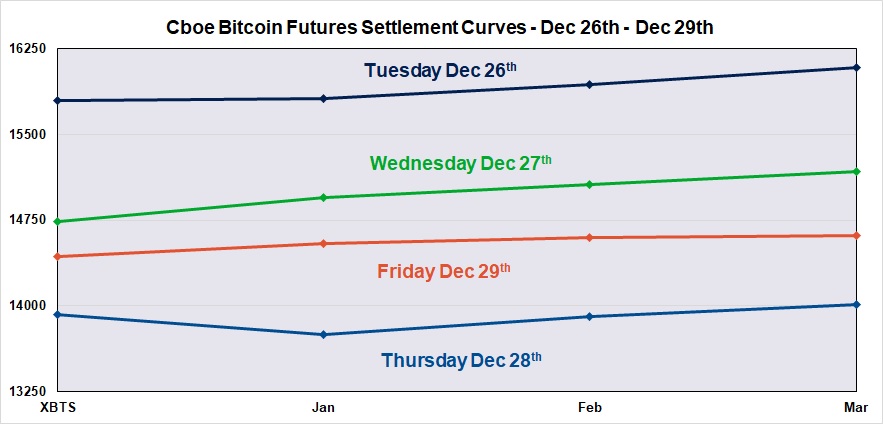
Finally, the last week of the year was a holiday shortened week with only four trading days to analyze. Below we can see that Thursday was the day with the widest spread between spot bitcoin and the January contract with the Gemini Auction price at $13,921.00 and the January contract at $13,755.00. In general, if there is any pattern it is since more market participants have been getting involved in Cboe Bitcoin Futures trading there has been less of a spread between the near dated futures and the spot bitcoin price.
Volume has been pretty solid for a new futures contract. The graphic below shows the daily volume for the first three weeks of Cboe Bitcoin Futures trading divided up over the three contracts currently available for trading.
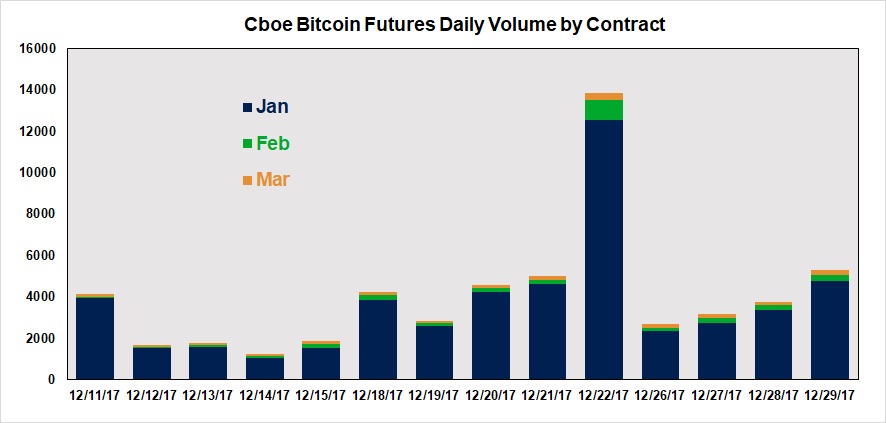
Note the biggest portion of the volume is concentrated in the January contract which is typical for futures markets. It also may make the most sense here as the futures price is now tracking very close to spot bitcoin price. On some days more March contracts have traded than February. Also, the open interest, as seen in the next graphic, for March was higher than February at the end of 2017.
As expected the greatest open interest is in the front month January contract and as previously mentioned March has higher open interest than February. One theory behind the greater open interest for March is that the contract is usually at a higher premium than February to spot bitcoin. This higher premium creates opportunities to buy spot bitcoin and sell the futures contracts in a spread trade. The expectation is that the futures and spot prices will converge as expiration approaches and a profit may be booked as the spread narrows.
Three weeks into trading the Cboe Bitcoin Futures are attracting more market participants and developing what will be typical price behavior. To learn more about Cboe Bitcoin Futures trading as well as sign up for bitcoin market updates visit www.cboe.com/bitcoin
RISK DISCLAIMER: Trading in futures products entails significant risks of loss which must be understood prior to trading and may not be appropriate for all investors. Past performance of actual trades or strategies cited herein is not necessarily indicative of future performance. The information contained herein is provided to you for information only and believed to be drawn from reliable sources but cannot be guaranteed; Phillip Capital Inc. assumes no responsibility for errors or omissions. The views and opinions expressed in this letter are those of the author and do not necessarily reflect the views of Phillip Capital Inc. or its staff.