Chart View: Now What? by Jeff Gilfillan

The U.S. election is behind us (maybe), and there is strong progress towards mainstream distribution of a COVID-19 vaccine in early to mid-2021. My Chart View post written several weeks prior to the election speculated that this event would be underwhelming to the markets.
I’ll continue to highlight three CME Group products - GC, ES and CL futures.
GOLD
CME Group gold futures (GC) went through the rinse cycle on a daily chart prior to and following the U.S. election. The market sold off before the election, rallied shortly afterwards, and sold off again as vaccine news took over the headlines. The trend continues to be bullish on LT and intermediate charts. Daily value has been adequately built between 1850 and 1950, and below 1850 the market will encounter either a transitional phase down to LT value starting at 1750 or rinse and repeat the bullish trend with a washout somewhere in between – 1820-1850.
Long term upside targets still in play around $2500 but no major value support until $1750 then $1550.
CME Group – COMEX Gold futures (GC)
First Value Level = 1700 – 1770
Second Value Zone = 1550 – 1580
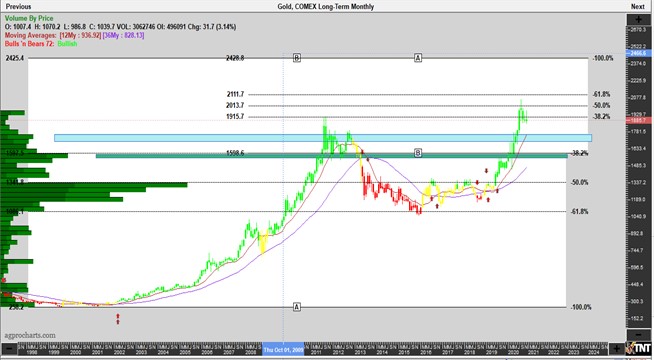
CME Group – CME Gold Futures Continuation Monthly
Chart – Track N’Trade
Futures trading is not for everyone. The risk of loss in trading can be substantial. Therefore, carefully consider whether such trading is suitable for you in light of your financial condition.
NASDAQ-100
Similar to gold futures, the CME E-mini Nasdaq futures broke 6-week highs and lows prior to and post-election. While the weakness did test my COVID period value support discussed last post, the short to long term bull trend remains strongly in place. In fact, on a short term basis the current value range (10700 – 11700) has expanded in size and has built similar value in structure to the late February through June range (8200-9600) built post-COVID-breakout in the U.S.
The ATR (average true range) discussed last post during COVID-19 has been a high of 1200 in late March and a low of 428 points in early June. The range since last post and through the election going back two weeks on a rolling weekly continuation chart was 496 to 903. This volatility should have come as no surprise given what we have witnessed in the last 8-9 months.
“Traders should not only be prepared for these contingencies but also be aware of recent ATR to anticipate ranges already in play and likely to continue going into event heavy periods.”
CME Group - E-mini Nasdaq-100 futures (NQ)
COVID Value range = 11037-11365
First Value Level = 9785
Value Zone = 6200-8100
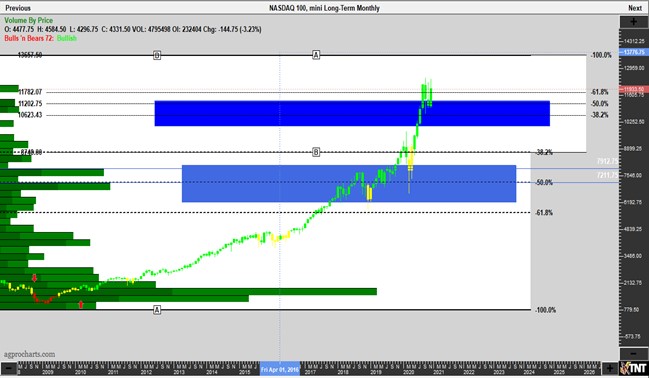
CME Group – E-mini Nasdaq-100 futures (NQ) Continuation Weekly
Chart – Track N’Trade
Futures trading is not for everyone. The risk of loss in trading can be substantial. Therefore, carefully consider whether such trading is suitable for you in light of your financial condition.
CRUDE OIL
Nothing new here…same comment as last post.
“The CME Group WTI Crude Oil futures (CL) displays a significant value resistance level on a monthly chart between $45-$55. This is perhaps the strongest indicator the overall market displays between a COVID world and a return to normalcy. This conversation is probably more fundamental than technical, but at least until the world becomes significantly cleaner with energy use, it’s an important chart to watch.”
CME Group - NYMEX WTI Crude Oil futures (CL)
COVID Value range = $17.00 - $23.00
First Value Resistance Level = $45 - $55
Second Value Resistance Level = $70.00
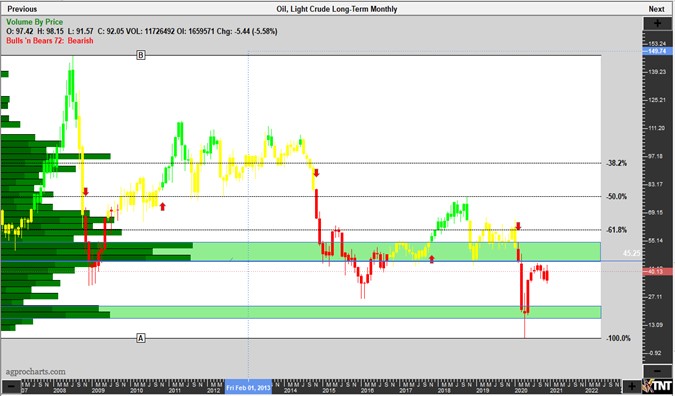
CME Group – NYMEX WTI Crude Oil futures (CL) Monthly Continuation
Chart – Track N’Trade
Futures trading is not for everyone. The risk of loss in trading can be substantial. Therefore, carefully consider whether such trading is suitable for you in light of your financial condition.
Disclaimer: Trading in futures products entails significant risks of loss which must be understood prior to trading and may not be appropriate for all investors. Past performance of actual trades or strategies cited herein is not necessarily indicative of future performance. The information contained herein is provided to you for information only and believed to be drawn from reliable sources but cannot be guaranteed; Phillip Capital Inc. assumes no responsibility for errors or omissions. The views and opinions expressed in this letter are those of the author and do not reflect the views of Phillip Capital Inc. or its staff.