Chart View: Calm Before the Storm - Navigating the Rapids on the Screen by Jeff Gilfillan

The U.S. election is on the horizon, and some brokerages and exchanges are adjusting in hopes of managing volatility. The CME is extending overnight circuit breakers from 3-5%. One large brokerage is at least temporarily raising initial margins requirements up to 35%.
This “Chart View” will continue to focus on markets discussed in previous 2020 Chart Views - Gold, E-mini Nasdaq-100, and Crude Oil Futures.
How many times have you watched a movie years ago that you consider a classic, only to be disappointed the second time around? My thoughts are that this November may be one of those shows. This is not to say the higher margins or wider circuit breakers are not wise. In the age in which liquidity comes from bytes and not brokers, many sources of liquidity turn off the algos and duck for cover until the overleveraged positions exit and new cash finds value.
(What movie did you watch years later that failed to live up to what your memory told you? Mine was Meatballs – still a great show, but my kids just did not give it the same reviews I did.)
When navigating the rapids, one factor to consider going into election time is the ATR or average true range of the products you are trading. Brokers and exchange clearinghouses generally use initial margin requirements as protection against a strong one day move so cash is in place to support a major move, then act swiftly to raise additional margin or offset positions to protect the system. Traders should not only be prepared for these contingencies but also be aware of recent ATR to anticipate ranges already in play and likely to continue going into event heavy periods. See my comments on the ATR under the NQ analysis.
GOLD
The CME Group COMEX Gold futures (GC) has been a strong store of value since June of 2019. The chart displayed below tracks value accumulation since the onset of the financial crisis. As you can view, the large majority of value has been built between 1170 to 1350 from 2013 till 2019. Since the June 2019 breakout around 1350, value has been steadily consistent from around 1350 all the way up to the mid-June breakout higher around 1750. There is a small range between 1500 and 1520 that captured a significant amount of value pre-COVID and then again in late March. Someone may have known something I didn’t in June and September of 2019 and March of 2020, but we’ll leave that to conspiracy tweeterites. The value levels displayed below combine fib price support levels with volume strength on a monthly scale.
CME Group – COMEX Gold futures (GC)
First Value Level = 1702 – 1730
Second Value Zone = 1550 – 1580
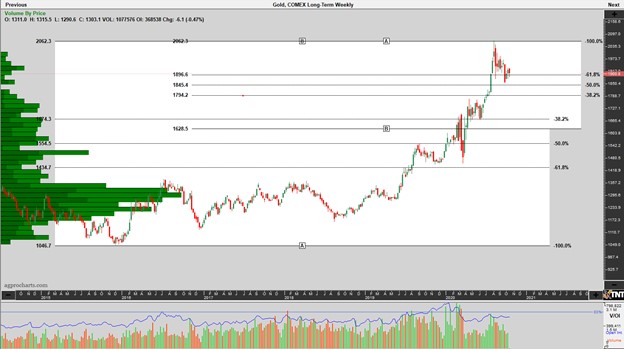
CME Group – CME Gold Futures Continuation Monthly
Chart – Track N’Trade
Futures trading is not for everyone. The risk of loss in trading can be substantial. Therefore, carefully consider whether such trading is suitable for you in light of your financial condition.
NASDAQ-100
The CME Group E-mini Nasdaq-100 futures (NQ) remains Chart View’s fiscal and monetary fueled rocket ship. Whether we have hit Mars yet is TBD. I have a Fibonacci projection at 13657 on a monthly chart, but projections with no value behind them are for Sunday mornings and business TV. COVID value range so far is between 11037 and 11365. The weekly value range going back to the onset of the financial crisis is 6200-8100. This range was tested during March and April, prior to and shortly after stimulus measures.
ATR
The NQ average true range going back two weeks on a rolling basis on a weekly continuation chart currently is 553 points as of 10/16. The COVID low was 428 points in early June, and the high was 1200 in late March. The financial crisis high was 268 points and the pre-COVID high was 513 points. I understand the point % moves are more telling vs. actual point moves, but the contract point value profit/loss stays the same. Takeaway is election or no election, COVID-driven volatility far outweighs past elections or financial system meteoric events. “It’s the economy, stupid.” -James Carville
CME Group - E-mini Nasdaq-100 futures (NQ)
COVID Value range = 11037-11365
First Value Level = 9785
Value Zone = 6200-8100
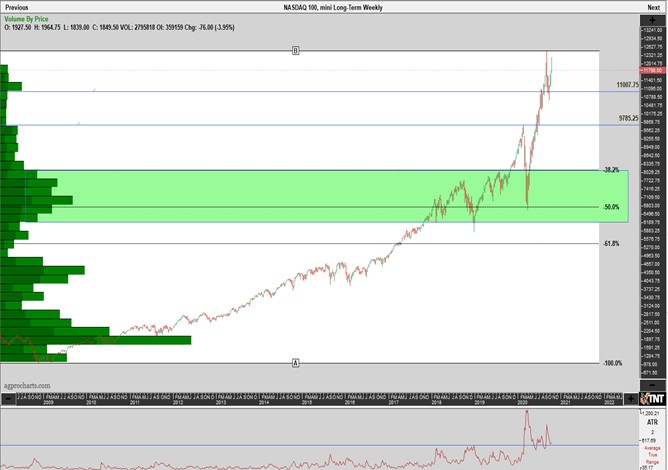
CME Group – E-mini Nasdaq-100 futures (NQ) Continuation Weekly
Chart – Track N’Trade
Futures trading is not for everyone. The risk of loss in trading can be substantial. Therefore, carefully consider whether such trading is suitable for you in light of your financial condition.
CRUDE OIL
The CME Group WTI Crude Oil futures (CL) displays a significant value resistance level on a monthly chart between $45-$55. This is perhaps the strongest indicator the overall market displays between a COVID world and a return to normalcy. This conversation is probably more fundamental than technical, but at least until the world becomes significantly cleaner with energy use, it’s an important chart to watch.
CME Group - NYMEX WTI Crude Oil futures (CL)
COVID Value range = $17.00 - $23.00
First Value Resistance Level = $45 - $55
Second Value Resistance Level = $70.00
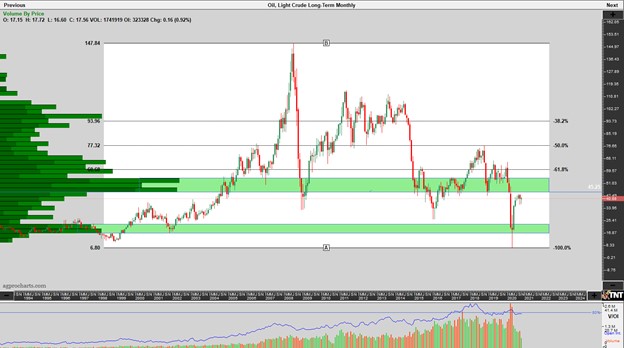
CME Group – NYMEX WTI Crude Oil futures (CL) Monthly Continuation
Chart – Track N’Trade
Futures trading is not for everyone. The risk of loss in trading can be substantial. Therefore, carefully consider whether such trading is suitable for you in light of your financial condition.
RISK DISCLAIMER: Trading in futures products entails significant risks of loss which must be understood prior to trading and may not be appropriate for all investors. Past performance of actual trades or strategies cited herein is not necessarily indicative of future performance. The information contained herein is provided to you for information only and believed to be drawn from reliable sources but cannot be guaranteed; Phillip Capital Inc. assumes no responsibility for errors or omissions. The views and opinions expressed in this letter are those of the author and do not reflect the views of Phillip Capital Inc. or its staff.