June Iron Ore Update
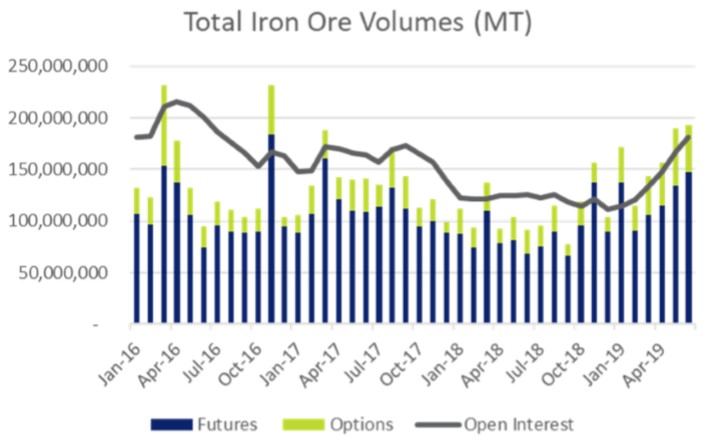
Total Iron Ore volume in June of 193,202,700 MT
*Highest monthly volume since November 2016
*Options volume was 46,215,000 MT (24% of total volumes)
*Highest quarter on record (540,246,100 MT)
*A total of 970,330,900 MT has traded from Jan-Jun 2019, up 54% vs the same period last year
-Annualised over 12 months, this is 1.94 billion MT, which will be the highest on record since the contract launched in 2009
*Average open interest for the month was at 181,479,020 MT
-Highest since July 2016
*The S&P GSCI Iron Ore moved significantly higher, by 14.9% in June, due to another drop in port inventories and additional Chinese government stimulus
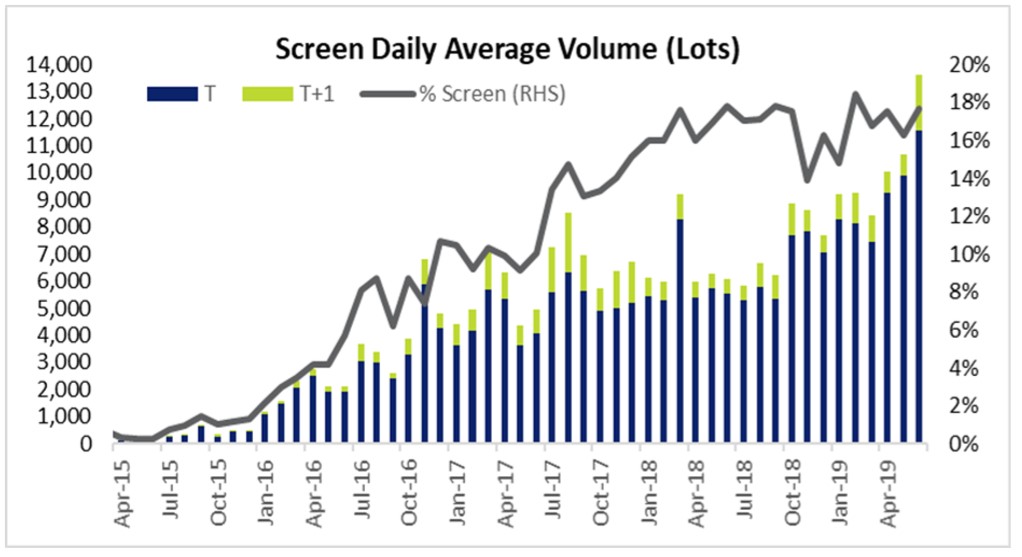
RECORD monthly screen DAV of 13,616 lots in June 2019 (excluding China public holidays)
*June 19 screen volumes totalled a record 259,966 lots accounting for 18% of total futures volume
*Average DAV since Oct-18 is 9,603 lots
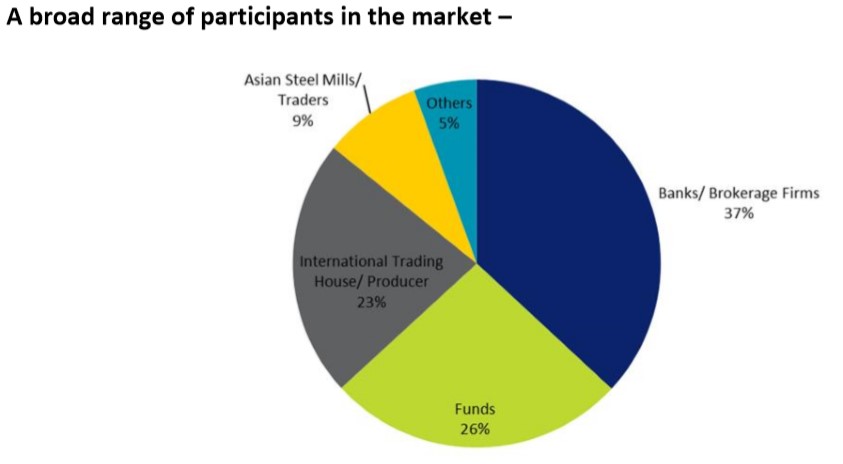
*The growing financialisation of iron ore has seen increasing participation by funds on the screen, further diversifying the participant pool
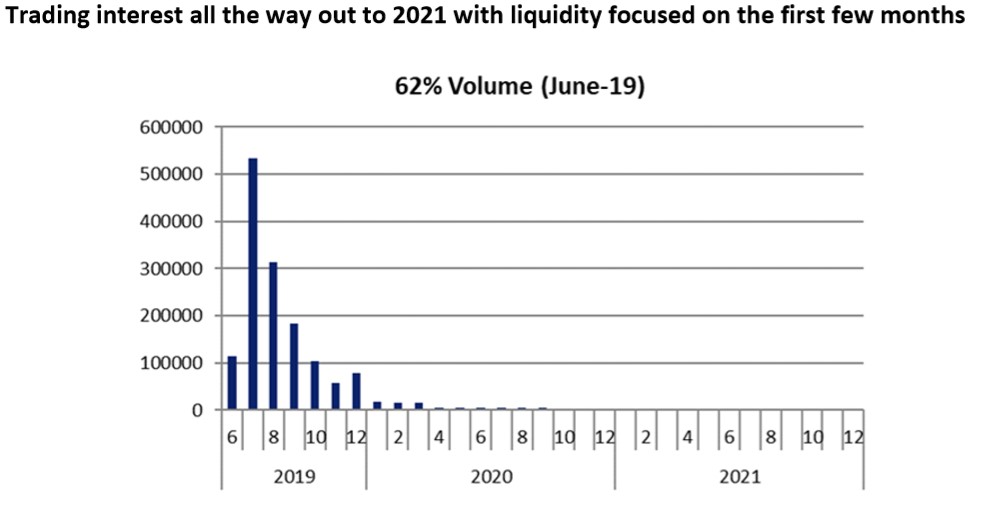
*Over 3,000 lots/month of quarterly strips have traded since this functionality was introduced in Nov-18 (both outright and spreads)
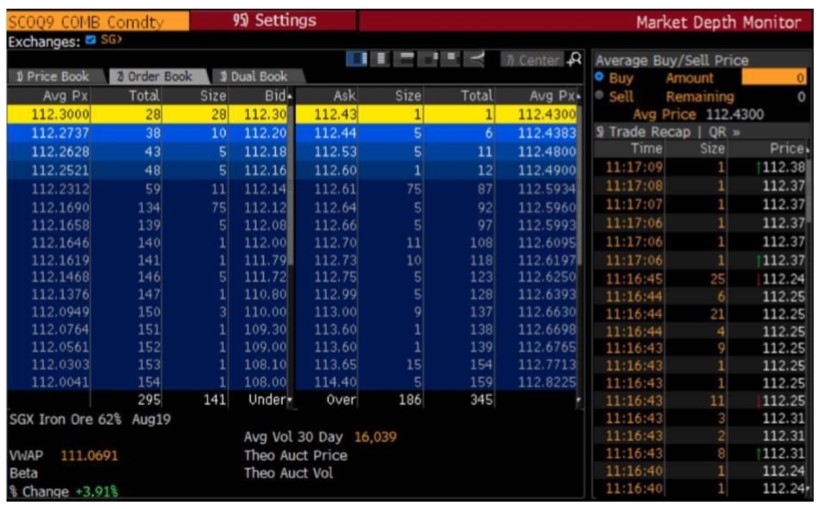
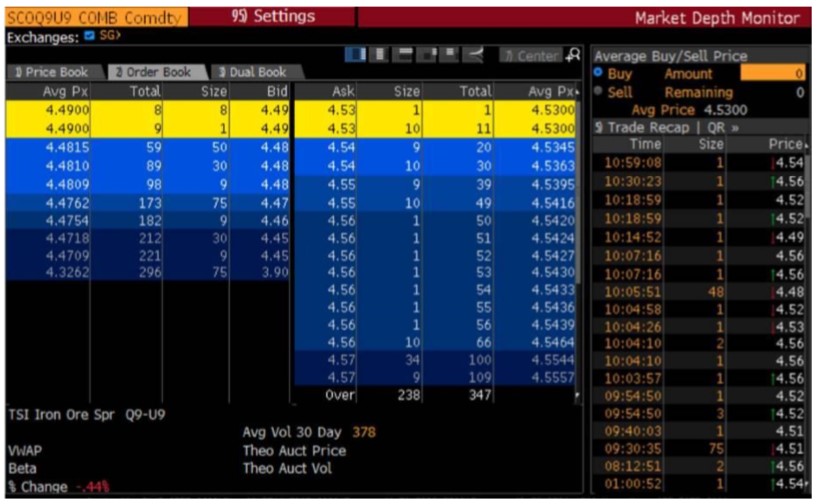
Consistent 2-way quotes and deep orderbooks
*Aug19 contract - best bid/offer <15cts
*Aug/Sep19 spread contract - best bid/offer <5cts
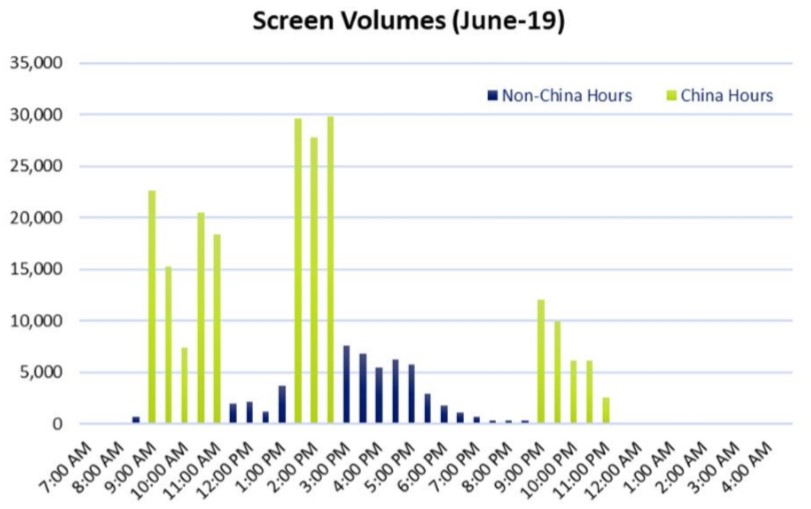
Growing liquidity when China is closed
*Market is continuously open for 21½ hours with active trading between 8am-11pm
*Active market makers providing competitive 2-way quotes after China market close. Spread is <$0.40 and depth is >100.
*On average 19% of screen volumes were traded when the Chinese market was closed – increasing and consistent volumes between 3-6pm
Bloomberg code: SCOA Comdty (Futures), SCOA Comdty OMON (Options)
*SCRA Comdty (Strip Futures)
Reuters code: SZZF