ICE: What Are the Differences Between ICE Brent and NYMEX WTI Futures?
Mike Wittner, Head of Oil Market Research, ICE
May 2020
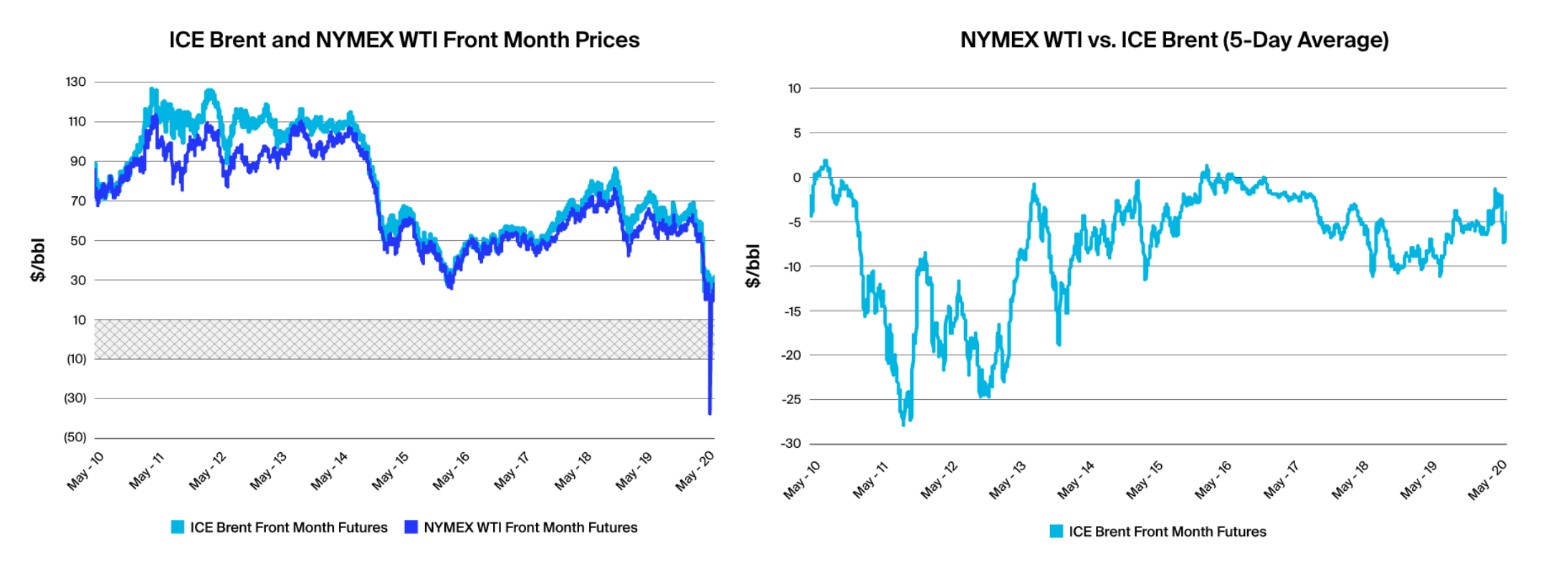
The world oil market is in the midst of a massive collapse in demand, driven by the impact of the coronavirus, combined with severe oversupply. As a result, there has been a rapid buildup in crude oil and refined product inventories, which has driven market fears of running out of storage space. Oil prices have staged a tenuous recovery so far in May, as the markets see signs of firming fundamentals ahead. However, during March and April, crude prices were under severe downward pressure. This was underscored by the collapse of NYMEX May WTI prices to negative values on April 20, 2020, the day before the contract expired. So what are the differences between ICE Brent and NYMEX WTI? Could the same thing happen to ICE Brent prices?
Source: ICE
Source: ICE
ICE Brent
Brent is a waterborne crude. It is a basket comprised of five different North Sea crudes (Brent, Forties, Oseberg, Ekofisk, and Troll, commonly referred to as BFOET). As a waterborne crude, it can be put on a vessel and shipped anywhere. Because of this, Brent reflects global oil market fundamentals and the global economy. This is reinforced by the fact that approximately 70% of the world’s traded crude is priced relative to Brent, including Dubai, Urals, and West African crudes.
Brent can be shipped and stored globally, either on land or in floating storage. As it has much more flexibility than WTI in terms of logistics and storage locations (see below), Brent is less prone to go negative.
Storage constraints for Brent
How much storage does Brent theoretically have access to? The International Energy Agency assessed global crude storage capacity in its monthly Oil Market Reports for April and May. Using various sources of data, the IEA estimated that including onshore storage (both commercial and government/strategic) and floating storage, there is 6.7 billion barrels of crude storage capacity in the world. For operational reasons, only around 80% +/- 5% is considered operational or working capacity; this works out to 5.0-5.7 billion barrels (mid-point of 5.35 billion barrels).
The IEA estimated that at the end of April, there were 4.6 billion barrels of crude in storage, or 86% of operational capacity. That left 750 million barrels of spare crude storage capacity remaining (relative to the mid-point). Aside from the IEA’s forecast that maximum operational crude storage capacity would be reached by mid-year, a key point was that onshore storage could become filled locally before it reached that point globally. They particularly warned about land-locked regions within North America or Russia - a dynamic that appears to have played out at Cushing (see below).
When storage approaches operational capacity, onshore storage fills first because it is cheaper. Floating storage is the last to fill as it’s more expensive and would hypothetically be the last available option to store Brent crude.
So how much storage is available to Brent? More than 1,300 large crude tankers or ~2.2 billion barrels of capacity are actively available in the global fleet, according to the IEA. Of this capacity, after taking into account vessels in-transit, loading, ballasting and vessels unavailable, the IEA estimated that at the end of April, 120-125 million barrels of crude were stored at sea, and a further 130-155 million barrels were available for floating storage if economic conditions were met. It’s this flexibility that enables Brent to more easily ride out periods of extreme storage shortages. The projected decline in global oil production in May is expected to ease the pressure on available crude storage capacity, both onshore and floating, according to the IEA.
This greater scope of logistics and storage flexibility - including onshore and floating - means Brent is less prone than WTI to going negative. Based on analysis and reporting in recent weeks, this view is widely held among oil market analysts and traders.
How the ICE Brent futures contract works
ICE Brent futures contract is a deliverable contract based on Exchange for Physical (EFP) delivery with an option to cash settle against the ICE Brent Index. This means that market participants have the option - but not the obligation - of taking physical delivery by using the EFP mechanism. This allows participants to swap a futures position for a physical one.
On contract expiry, ICE Brent futures prices converge with the physical Brent market through the ICE Brent Index. The ICE Brent Index “represents the average price of trading in the BFOET (Brent-Forties-Oseberg-Ekofisk-Troll) cash or forward (‘BFOET Cash’) market in the relevant delivery month, as reported and confirmed by the industry media. Only published cargo size (600,000 barrels) trades and assessments are taken into consideration in the calculation.”
The EFP mechanism together with the ICE Brent Index ensures that the futures market remains linked with the physical Brent market. It ensures that the fundamentals driving the physical market are translated into the futures contract expiry price. In other words, if a market participant is left with a long or short futures position on expiry, the ICE Brent Index ensures that the expiry price for the cash-settled contract is the value at which physical Brent is trading.
NYMEX WTI
In contrast to Brent, WTI Cushing is a landlocked regional crude, which reflects market fundamentals in the midcontinent region of the US. It has storage and logistics constraints at a very specific location: Cushing, Oklahoma. There is limited pipeline capacity to get crude in and out of Cushing, and limited crude storage capacity there.
How the NYMEX WTI futures contract works
NYMEX WTI futures are physically deliverable at Cushing. On contract expiry, a participant who has an open long position must accept delivery of physical WTI crude. Similarly, a participant who has an open short position must make delivery of physical WTI crude.
NYMEX WTI futures contracts expire three business days prior to the twenty-fifth calendar day of the month before delivery (adjusted earlier if the twenty-fifth is not a business day). Physical delivery is made between the first and last day of the delivery month. For example, the May 2020 contract expired on April 21, 2020. For that contract, physical delivery has to be made between May 1 and May 31, 2020. In short, there are just nine days in the May 2020 example between expiry and the beginning of the delivery period.
Storage constraints for WTI
Delivery has to be made and accepted at any pipeline or storage facility in Cushing with access to designated storage facilities. Therefore, the most important constraint for NYMEX WTI futures is simply Cushing crude storage vs. Cushing storage capacity. Working storage capacity at Cushing is 75.8 million barrels, according to the US Energy Information Administration.
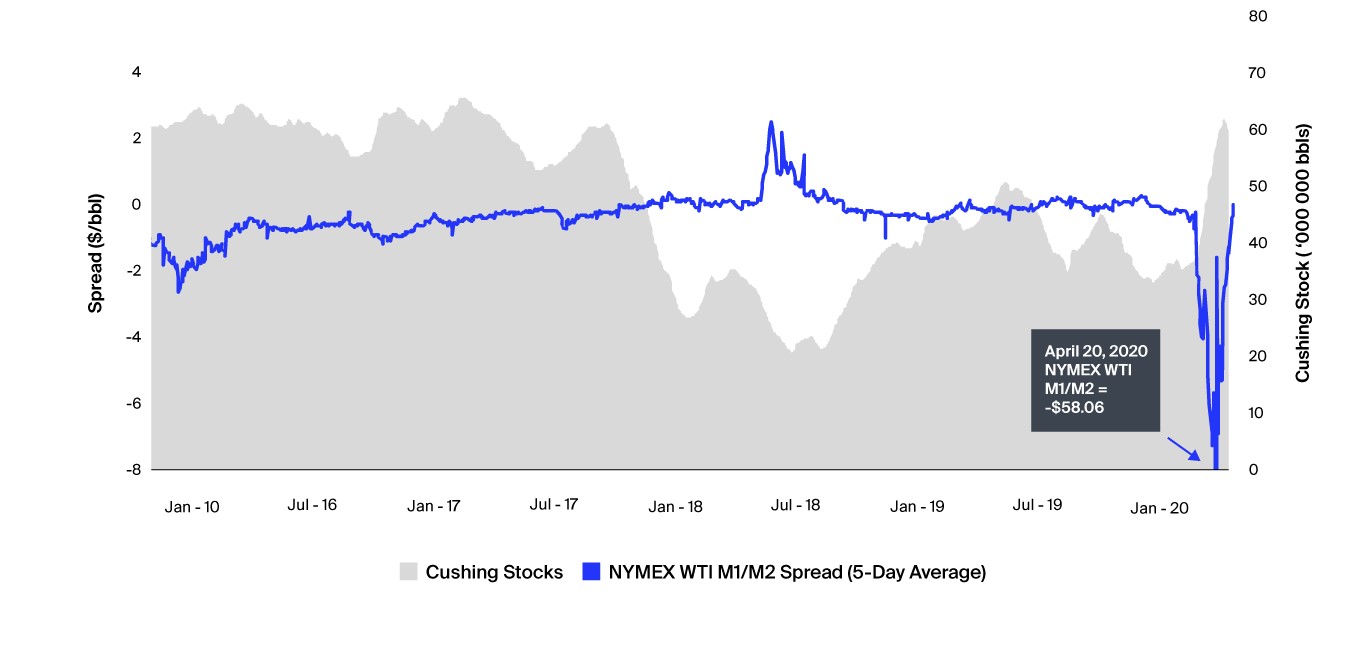
The greater sensitivity of WTI prices to Cushing inventory constraints can magnify the impact of a crude shortage or oversupply. As shown below, as fundamentals in the US mid-continent weaken (due to a combination of weak demand and strong supply resulting in inventory builds) the contango (spot discount vs. forward premium) gets steeper. This is a self-reinforcing cycle: stockbuilds weigh on the front of the curve, which incentivizes more stockbuilds, which weighs further on the front of the curve, and so on. In addition, as demand for storage increases, it becomes more expensive, which also causes steeper contango.
The same relationship between fundamentals/inventories and prices holds for Brent too. However the key difference is that while WTI is driven by regional fundamentals and Cushing logistics and storage constraints, Brent is driven by global fundamentals - and as a seaborne crude, has far more flexibility in terms of storage.
Cushing crude stocks and capacity are extremely transparent, because they are reported each week by the US EIA. As of May 8, Cushing stocks1 stood at 60.2million barrels, or 79% of working capacity, leaving only 15.7 million barrels spare. In addition, from early/mid-April through early May, all remaining storage has reportedly been leased.
NYMEX WTI Time Spread vs. Cushing Crude Stocks
Cushing Crude Stocks and % Working Storage Capacity
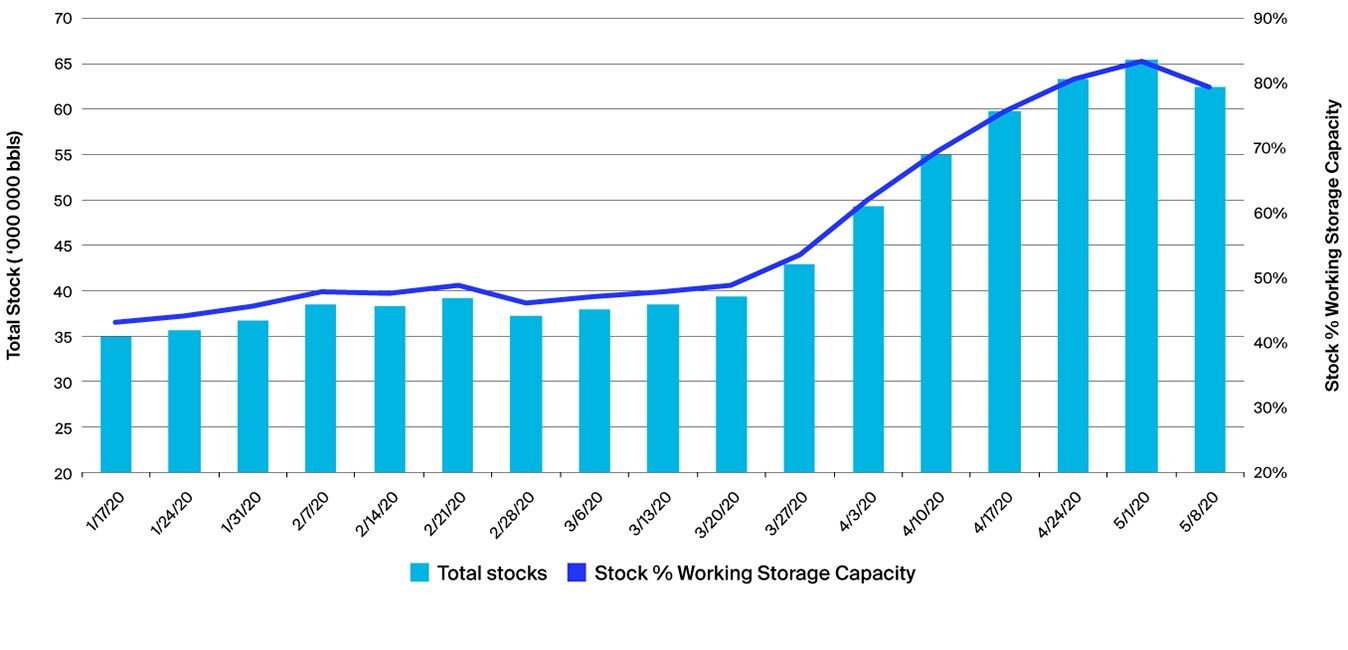
Source: US Energy Information Administration
Market and price implications of the differences in ICE Brent and NYMEX WTI
As Brent reflects global fundamentals and doesn’t have regional logistics and storage constraints, it is less subject to extreme price swings than WTI, particularly at the front of the forward curve. This can be seen on the chart below, where Brent Month 1 to Month 2 timespreads are less volatile than WTI Month 1 to Month 2 timespreads.
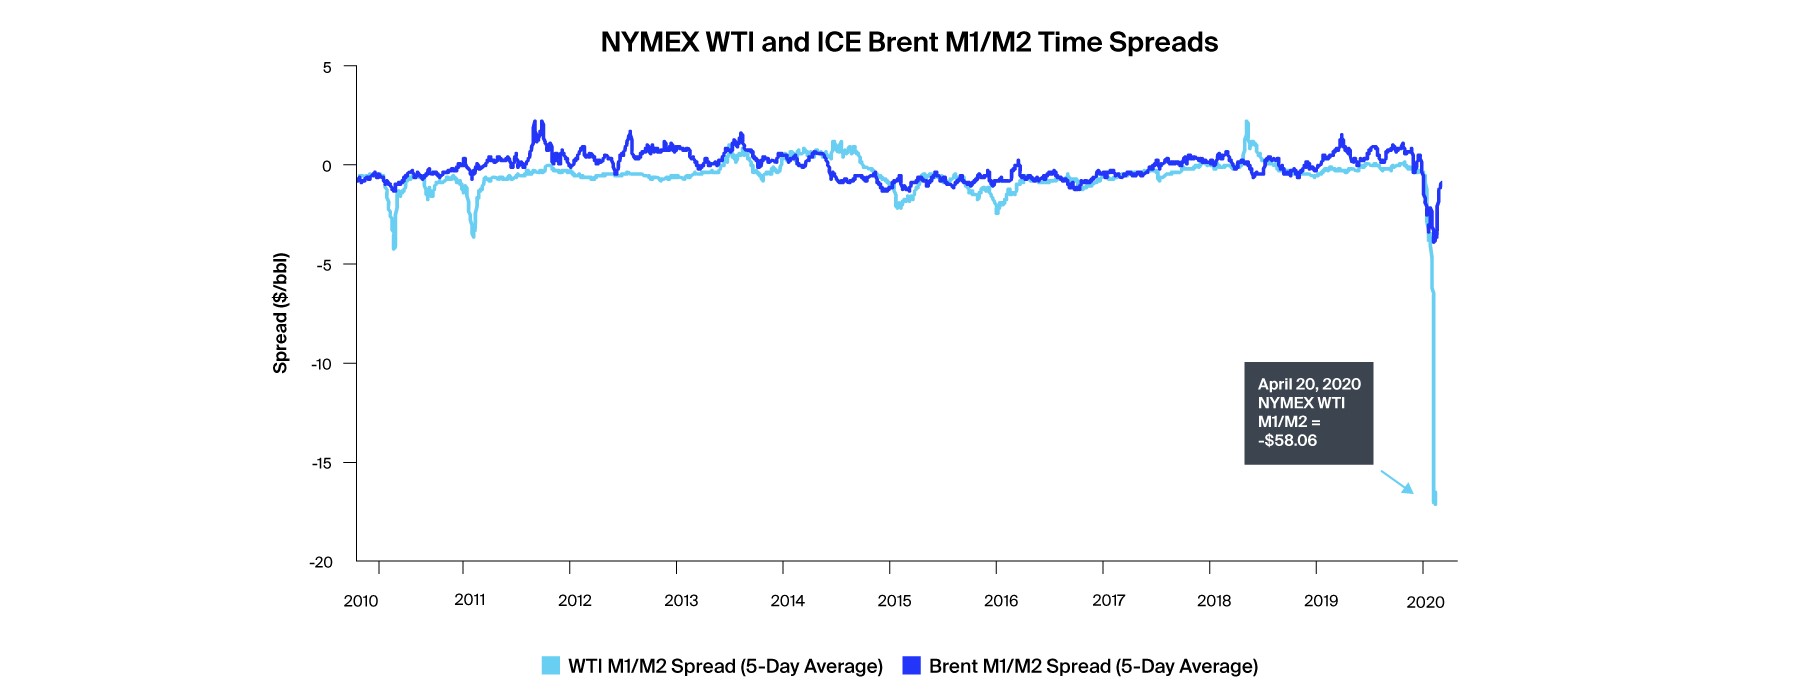
Source: ICE
For the same reasons, and directly driven by the less extreme price swings, the realized volatility for Brent is lower than WTI. This is shown in the charts below. Over a long history, from June 2015 to December 2019, Brent volatility averaged around 3% less than WTI volatility - a material difference (left hand chart). This can reduce the costs of investing and of hedging those investments. The comparison in volatility from January 2020 onwards is shown separately (right hand chart) as the recent extreme price movements in WTI, including negative values, caused WTI volatility to spike.
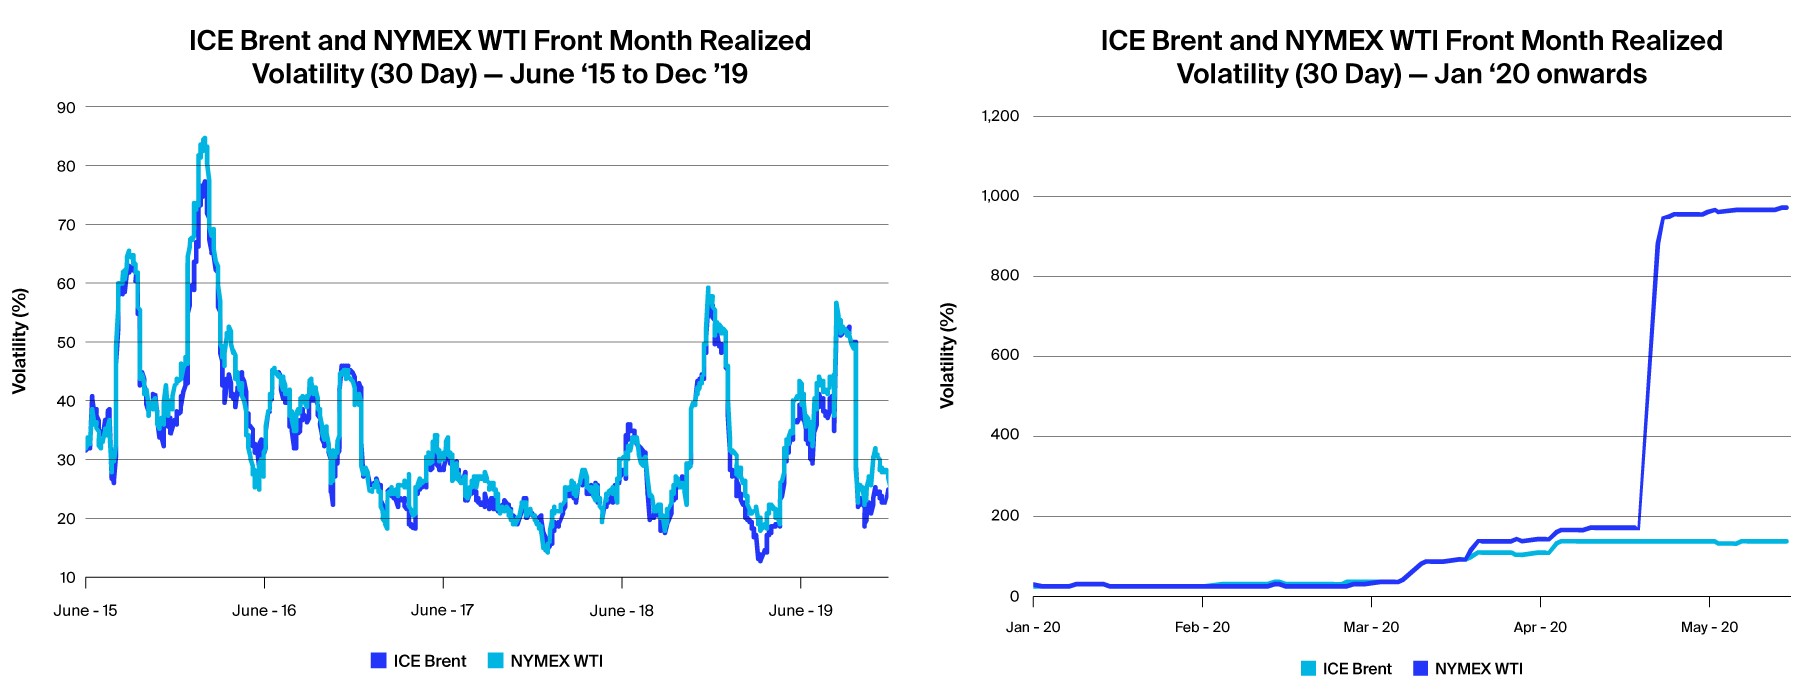
Source: ICE
Once again, directly related to less extreme swings in timespreads for Brent compared to WTI, the roll-yield return for Brent is higher than for WTI. The roll-yield is the return from simply buying the front-month contract, holding it until expiry, and then selling it and buying the next front-month contract. In other words, the participant always holds the front-month and “rolls” it to the next month upon expiry.
In a “contango” market (front-month discount vs. forward month premium), the roll yield is negative, because the participant has to sell at a lower price and buy at a higher price -- losing money every time that happens. In a “backwardated” market (front-month premium vs. forward month discount), the roll yield is positive, because the participant has to sell at a higher price and buy at a lower price -- making money every time that happens. When the market is oversupplied relative to demand (as it is currently), the forward curve is usually in contango; when the market is undersupplied relative to demand, the forward curve is usually in backwardation.
The chart below shows that every year since 2009, with only two exceptions, the roll yield for Brent outperformed WTI; Brent was either more positive or less negative than WTI. The first exception was in 2014, which followed the opening of significant new pipeline capacity from Cushing to the US Gulf Coast; this helped alleviate a previous period of structural oversupply at Cushing, which had caused prolonged relative weakness in WTI timespreads. The second exception was in 2018. In late June and July, an outage at a major Canadian synthetic crude production facility limited volumes available for shipment to Cushing; at the same time, refinery crude runs in the mid-continent region were very strong. These factors caused rapid stockdraws at Cushing and steep backwardation in WTI; the result was that the annual roll yield for WTI was slightly higher than for Brent. The ability to quickly move Brent on vessels around the world makes it adaptable and sensitive to short term global supply and demand conditions.
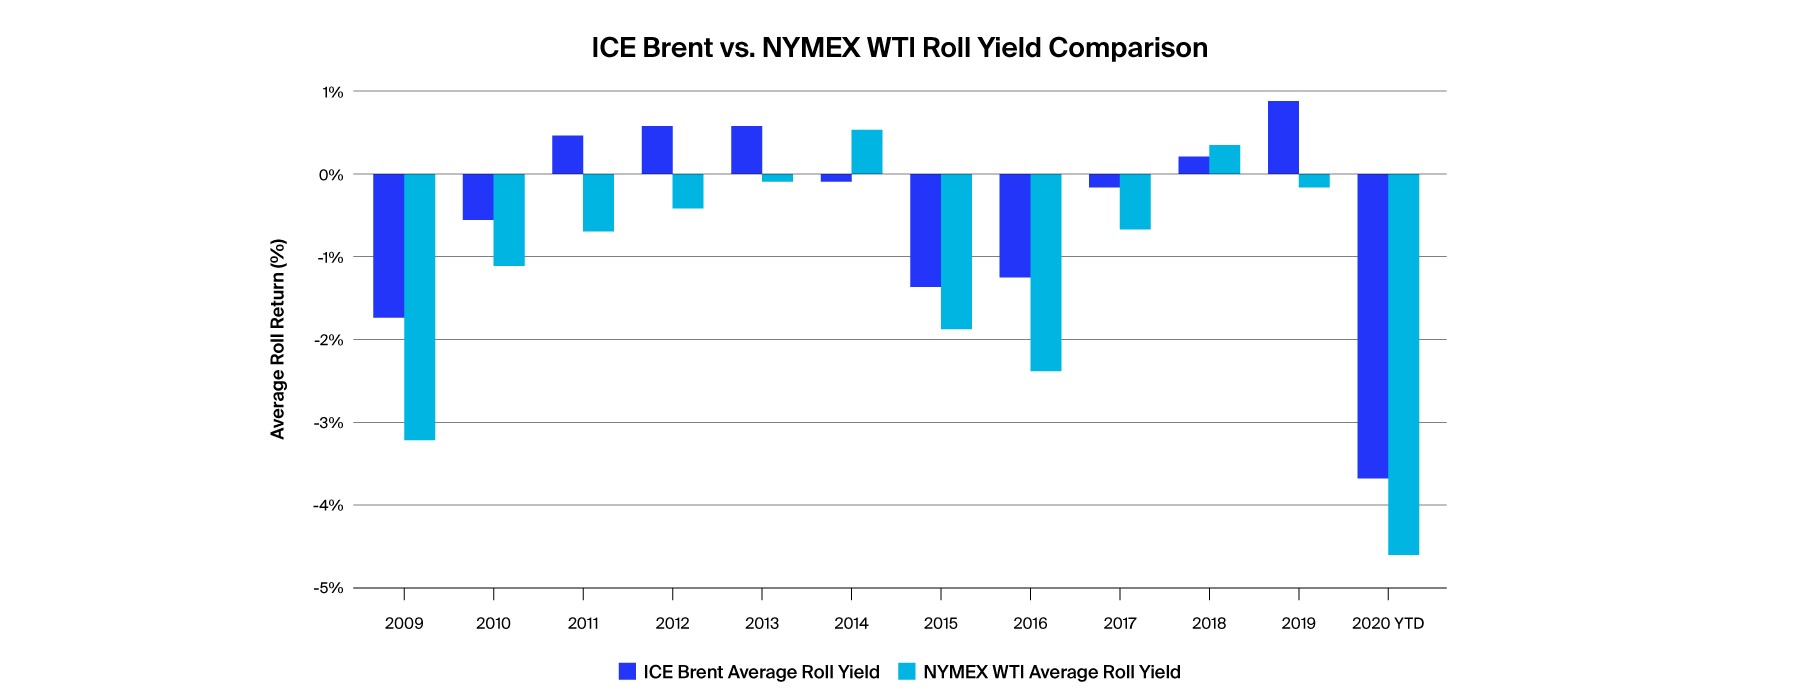
Source: ICE
Another factor is that, compared to WTI, Brent attracts a higher proportion of commercial participants, and a lower proportion of non-commercial investors (managed money). Commercial participants include producers, refiners, consumers, and merchants (physical traders); simply put, this is what most people think of as “the oil business”. The goal of commercials is generally to manage risk.
Non-commercial participants (managed money), include investors of different types, such as asset managers, hedge funds, and algorithmic traders. With some exceptions such as trend-followers, most non-commercials also tend to take positions and make investments based on current and anticipated oil market fundamentals. However, it is generally accepted that these investor flows tend to exaggerate and add momentum to fundamentally driven price moves in both directions - they increase both the magnitude and speed of price movements. This is because in contrast to commercials, the goal of managed money participants is not to manage risk, but to take risk. Investor flows can be less steady and more unpredictable that commercial hedging activity.
As ICE Brent relative to NYMEX WTI has a more diverse mix of participants, this allows Brent to more accurately reflect global oil market fundamentals and makes Brent less subject to the extreme price swings caused by investor flows.
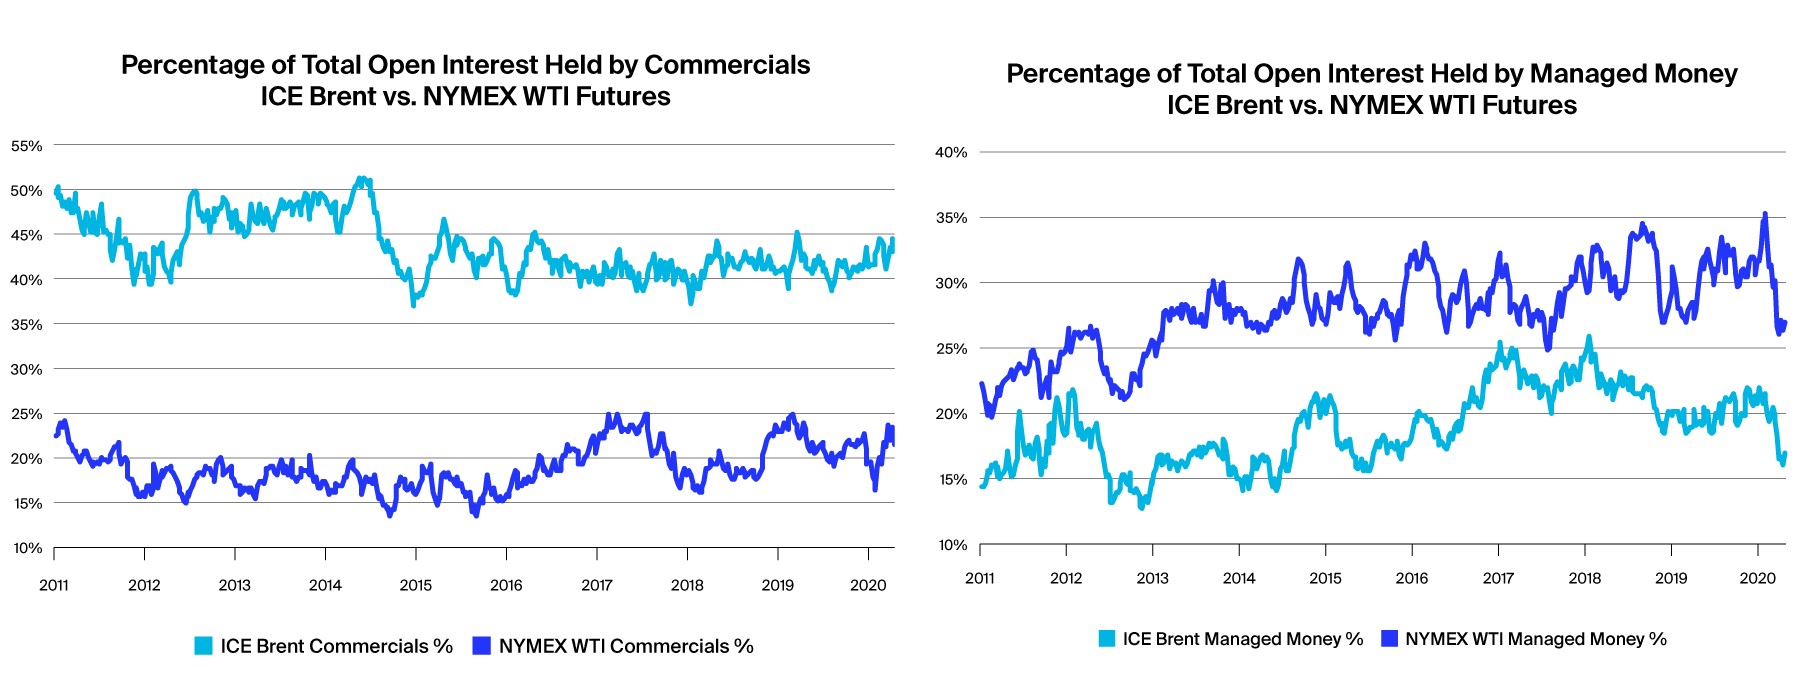
Source: ICE, CFTC
1 After adjustment for pipeline fill
© 2020 Intercontinental Exchange, Inc. The information and materials contained in this document - including text, graphics, links or other items - are provided "as is" and "as available." ICE and its subsidiaries do not warrant the accuracy, adequacy or completeness of this information and materials and expressly disclaims liability for errors or omissions in this information and materials. This document is provided for information purposes only and in no way constitutes investment advice or a solicitation to purchase investments or market data or otherwise engage in any investment activity. No warranty of any kind, implied, express or statutory, is given in conjunction with the information and materials. The information in this document is liable to change and ICE undertakes no duty to update such information. You should not rely on any information contained in this document without first checking that it is correct and up to date. The content of this document is proprietary to ICE in every respect and is protected by copyright. No part of this material may be copied, photocopied or duplicated in any form by any means or redistributed without the prior written consent of ICE. All third-party trademarks are owned by their respective owners and are used with permission.
Trademarks of ICE and/or its affiliates include, but are not limited to, Intercontinental Exchange, ICE, ICE Brent and the ICE Brent Index. Information regarding additional trademarks and intellectual property rights of Intercontinental Exchange, Inc. and/or its affiliates is located at https://www.intercontinentalexchange.com/terms-of-use.