CHART VIEW – Interest Rates & Gold
By Jeff Gilfillan
My focus the last two newsletters (April and March) was built around a supportive bounce in interest rate futures (30 year) prices and a test of the 2.62-2.68 range in the CBOE Interest Rate 10 Year Note (TNX). The charts tested 2.72 in the TNX and hit two upside targets in the 30 year futures, effectively shaking out weak positions chasing the late January, early February breakouts. The charts also ran up against the resistance levels noted in our February post on the ES.
Moving forward, keep a close eye on the TNX rate which tested the 3.04 high dating back to December 2013 and maybe on the verge of a larger breakout (TNX higher, 10/30 year interest rate futures lower).
CME COMEX Gold futures is still trading close to the LT 50% level (1296). It hit a double bottom on a front-month basis weekly chart for 2018 at the 1301.80 / 1302.60 levels but failed to sustain. I suspect the Dec 2017 washout down to 1236.50 squeezed the weaker longs. It may take some time but the gold market has good potential to the upside considering the large value base built on the charts since 2013 accompanied by the relatively strong volume levels displayed since Dec 2017.
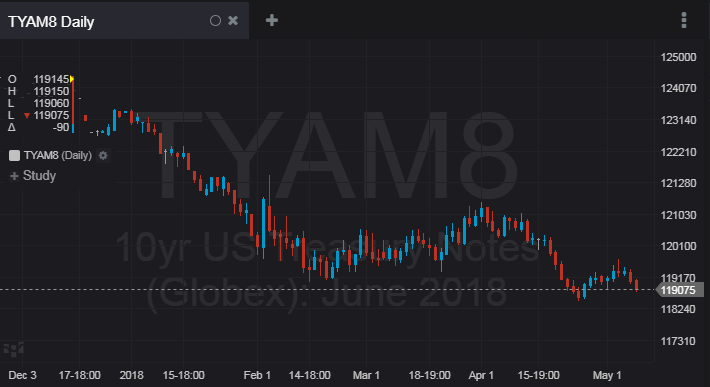
CME Group – TYAM8 – DAILY – 10yr US Treasury Notes (Globex)
CHART - CQG Desktop – Next Generation Trading and Data Visualization
Futures trading is not for everyone. The risk of loss in trading can be substantial. Therefore, carefully consider whether such trading is suitable for you in light of your financial condition.
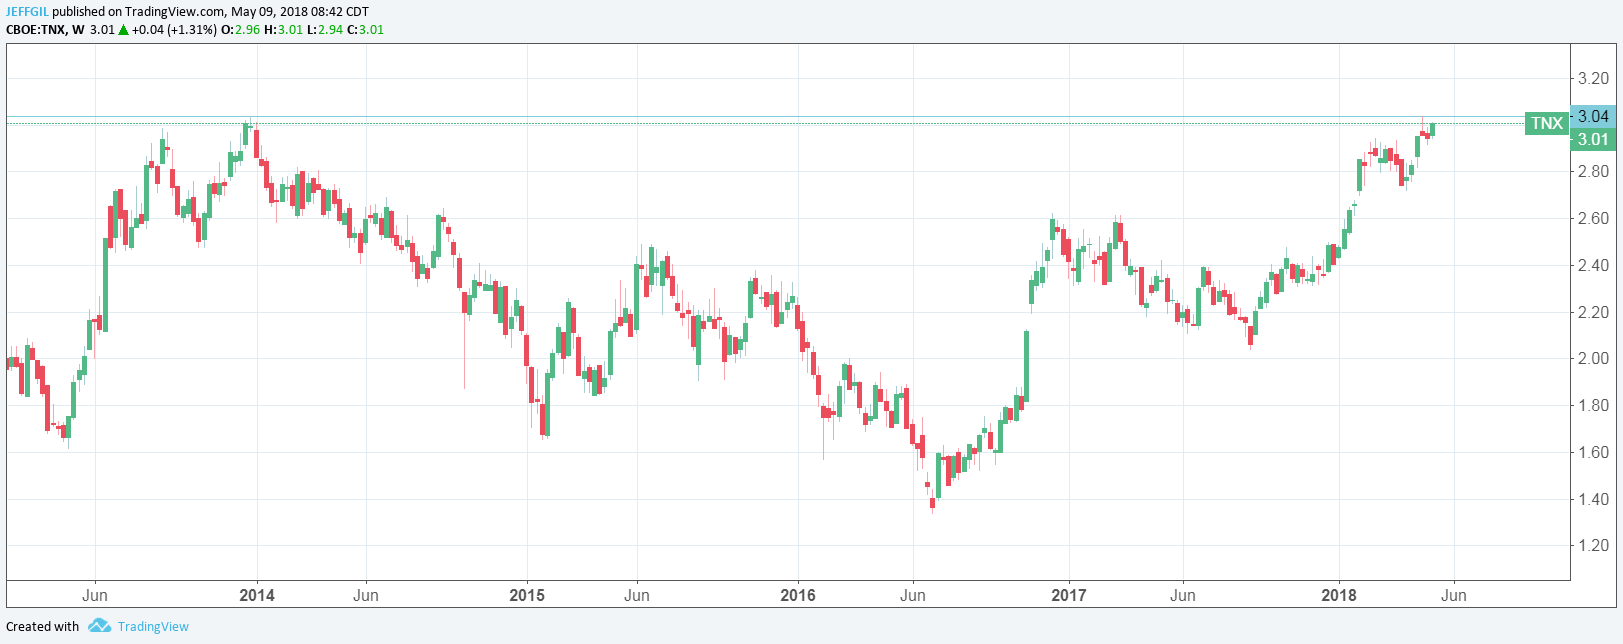
CBOE – INTEREST RATE 10 YEAR T NOTE: TNX, Weekly Chart
Chart – TradingView.com
Futures trading is not for everyone. The risk of loss in trading can be substantial. Therefore, carefully consider whether such trading is suitable for you in light of your financial condition.
RISK DISCLAIMER: Trading in futures products entails significant risks of loss which must be understood prior to trading and may not be appropriate for all investors. Past performance of actual trades or strategies cited herein is not necessarily indicative of future performance. The information contained herein is provided to you for information only and believed to be drawn from reliable sources but cannot be guaranteed; Phillip Capital Inc. assumes no responsibility for errors or omissions. The views and opinions expressed in this letter are those of the author and do not reflect the views of Phillip Capital Inc. or its staff.
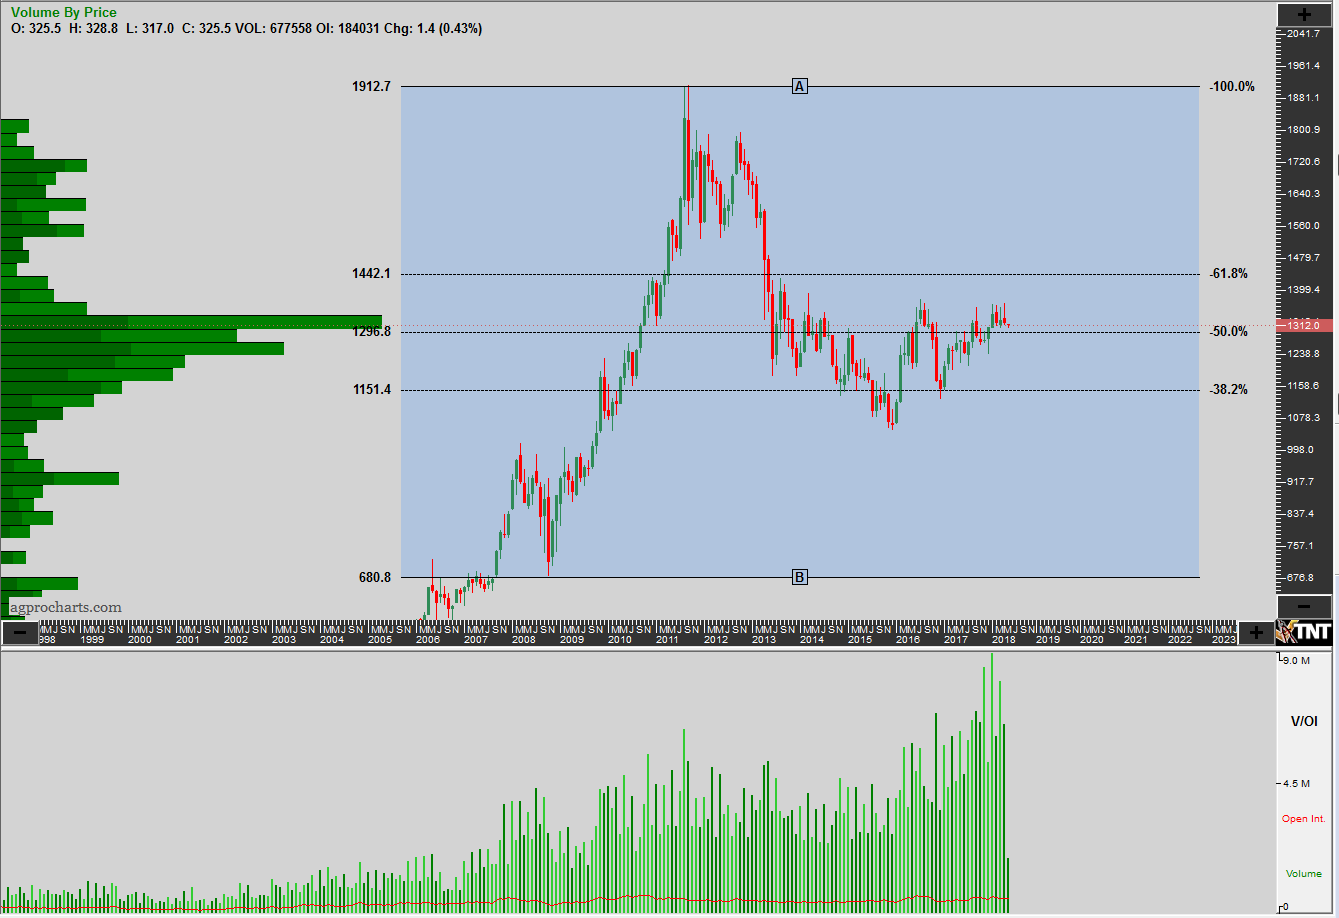
CME Group – GC – MONTHLY – GOLD COMEX (Globex)
Chart – Track’NTrade
Futures trading is not for everyone. The risk of loss in trading can be substantial. Therefore, carefully consider whether such trading is suitable for you in light of your financial condition.