Chart View: CBOT Corn Futures by Jeff Gilfillan
Corn futures are trading just above the most popular value range over the previous 5 years at 378 ¾ basis March19’ as of the close on 02/13. This range between 347 and 381 is the most heavily traded 30 cent range since the early 90s in terms of volume. You have to go back 60 years using historical data and Volume by Price bars to find a comparable value area (247 and 277). However, the 247-277 value area took 60 years to match the volume built within the current range which for the most part developed post ethanol mandate era starting in late 2007.
Flat price median levels over the long run (past 30 years) is just under 500 and just under 570 in the ethanol era. Following the 2014 weather related market, the median price level based on end of day pricing is just below 370 which also matches volume-based value range key support during same period.
Going into the growing season front month corn futures flat price resistance is around 385 and upside washout area is just above 4.00. This area could be an area the market tests for several sessions to squeeze shorts or lure fresh longs. Flat price support is 365-370 front month and downside washout areas start around 355.
Given the fundamentals, it is difficult to imagine a catalyst strong enough to project prices into a transitional period away from the current 5-year value range; however, technically a move higher that is transitional in structure could easily test 2014 highs at 520. If you draw a basic H&S formation on a weekly chart the neckline would sit around 400; the move would find some validation on a break over 2018 highs at 412 ¼; and the target would be close to the 2014 highs.
Phillip Capital Agribusiness
Phillip Capital Inc. offers risk management brokerage through our introducing broker network and Direct Clearing for Agribusiness Hedging Operations.
Keep up to speed with mobile news and market commentaries in grains/soy, meats, metals, energies, softs, financials & weather using Phillip Capital Market Center. Download QT Quotes on your phone and email sales@phillipcapital.com for a username/password.
JG
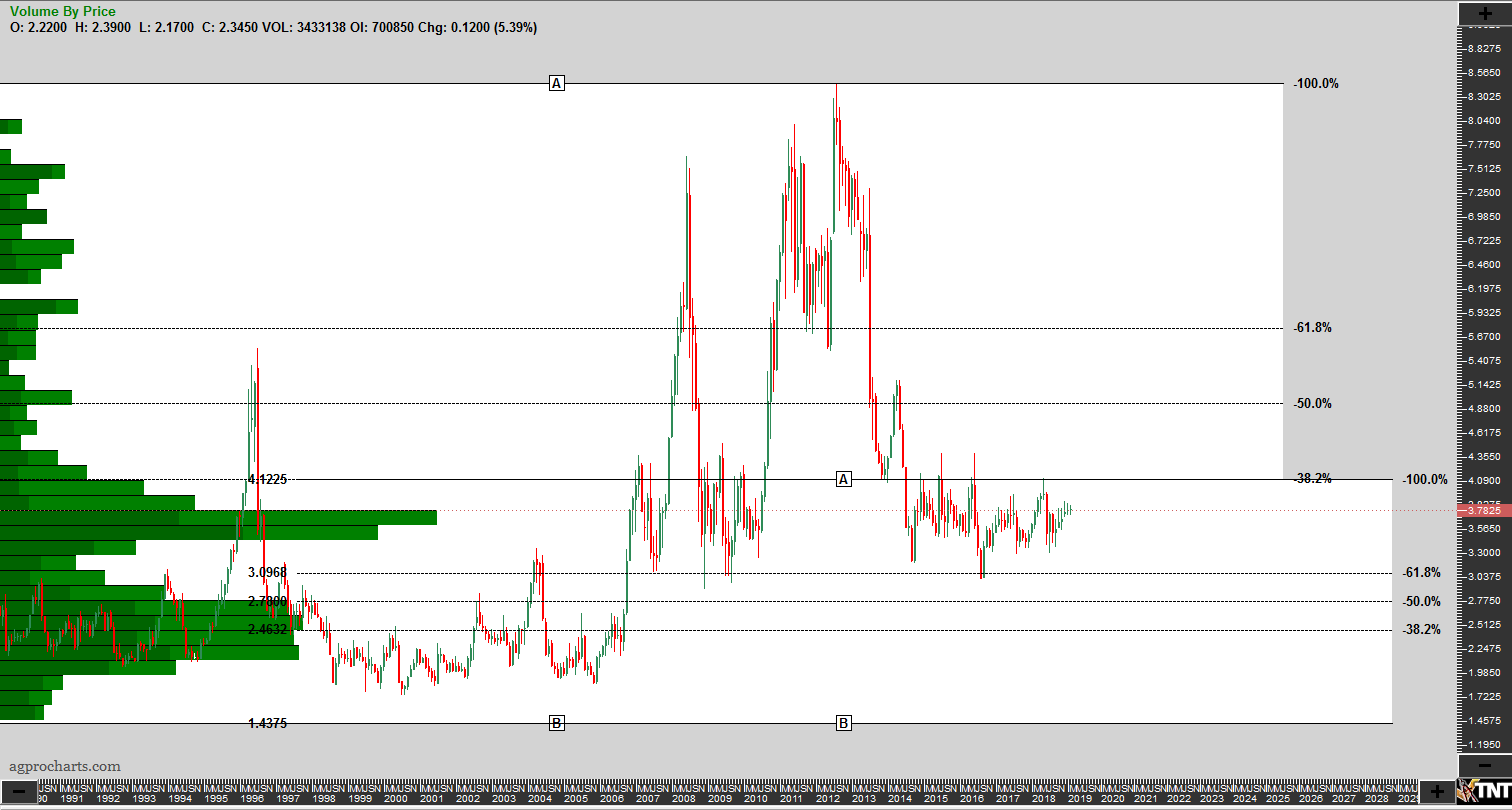
CME Group – CBOT (ZC) Corn Futures Continuation Monthly
Chart – Track N’Trade
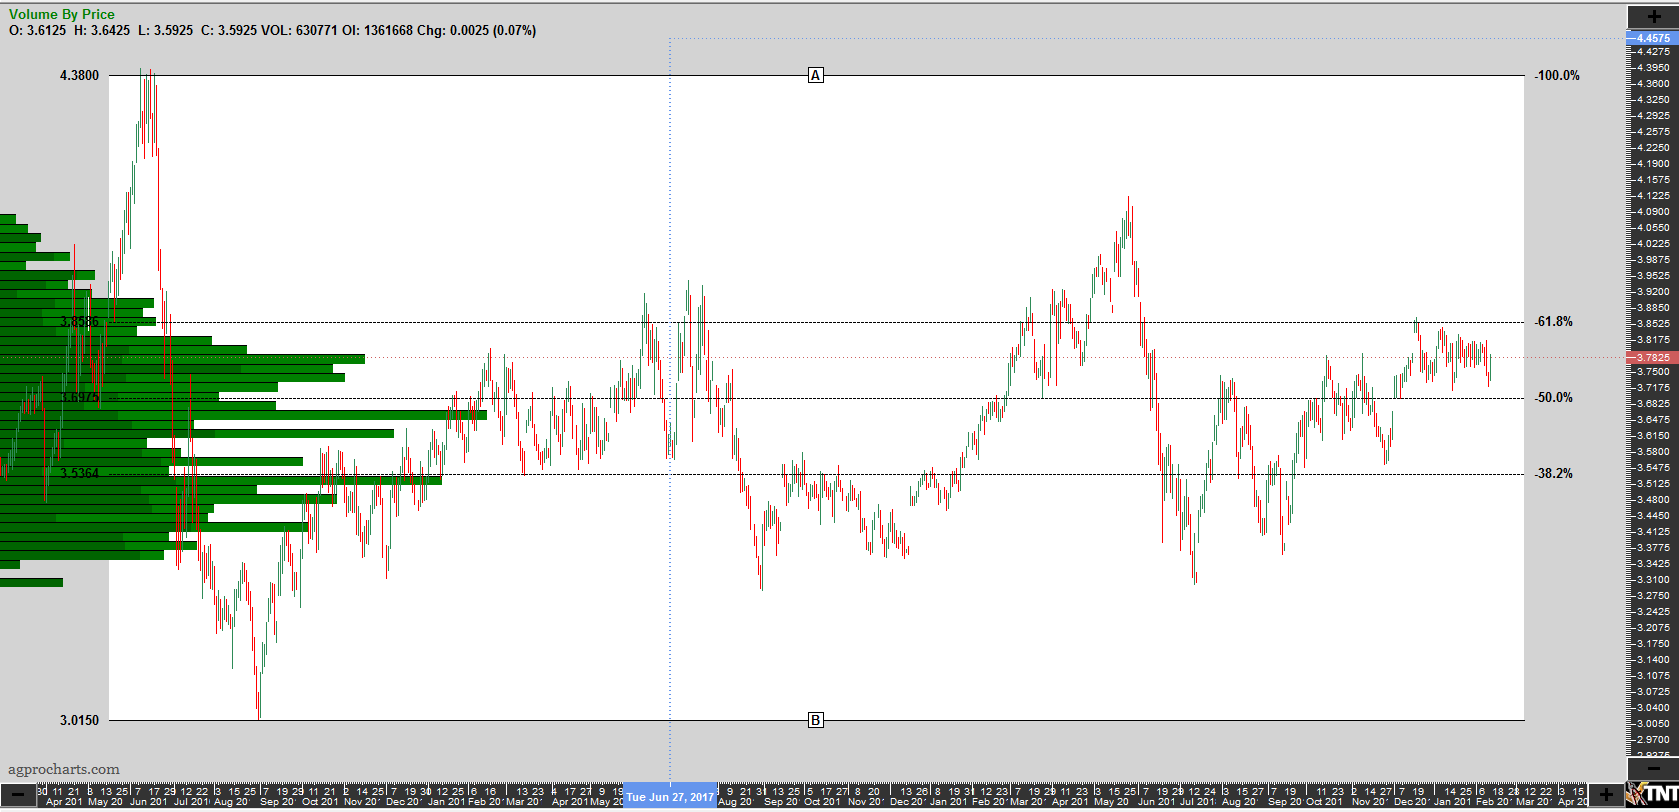
CME Group – CBOT (ZC) Corn Futures Continuation Monthly
Chart – Track N’Trade
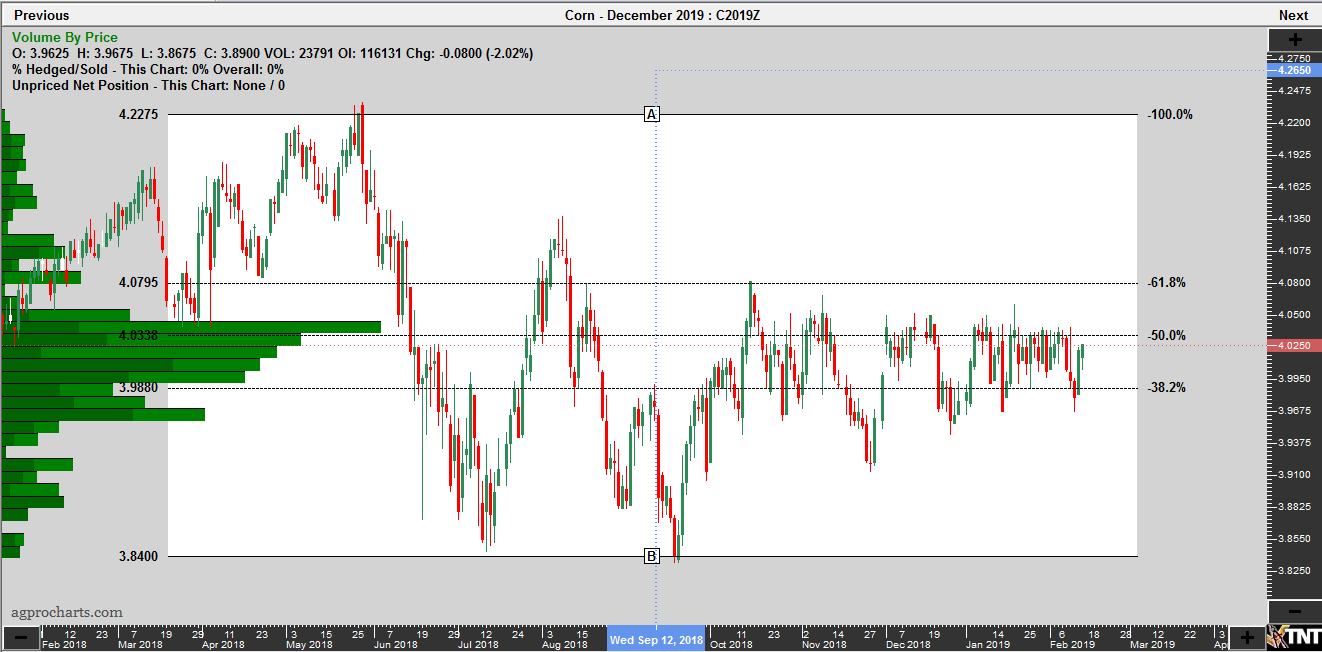
CME Group – CBOT (ZC) Corn Futures Continuation Daily
Chart: Track N’Trade
RISK DISCLAIMER: Trading in futures products entails significant risks of loss which must be understood prior to trading and may not be appropriate for all investors. Past performance of actual trades or strategies cited herein is not necessarily indicative of future performance. The information contained herein is provided to you for information only and believed to be drawn from reliable sources but cannot be guaranteed; Phillip Capital Inc. assumes no responsibility for errors or omissions. The views and opinions expressed in this letter are those of the author and do not reflect the views of Phillip Capital Inc. or its staff.