The Chartist View: Crude Oil Futures Volume by Price
By Jeff Gilfillan
NYMEX WTI Crude futures front month contract has traded in a $15-16 range (low 39.19 / high 55.24) since May of 2016. The bulk of the volume/value occurred between $44 - $54 per barrel range. In September, OPEC announced extended cuts to production. Leading into this meeting the markets bought the rumor and after trading to just under $53 per barrel in late September the market squeezed weak longs and touched just above $49 and swiftly bounced. CL has not looked back since, breaking highs not seen since 2015 this month.
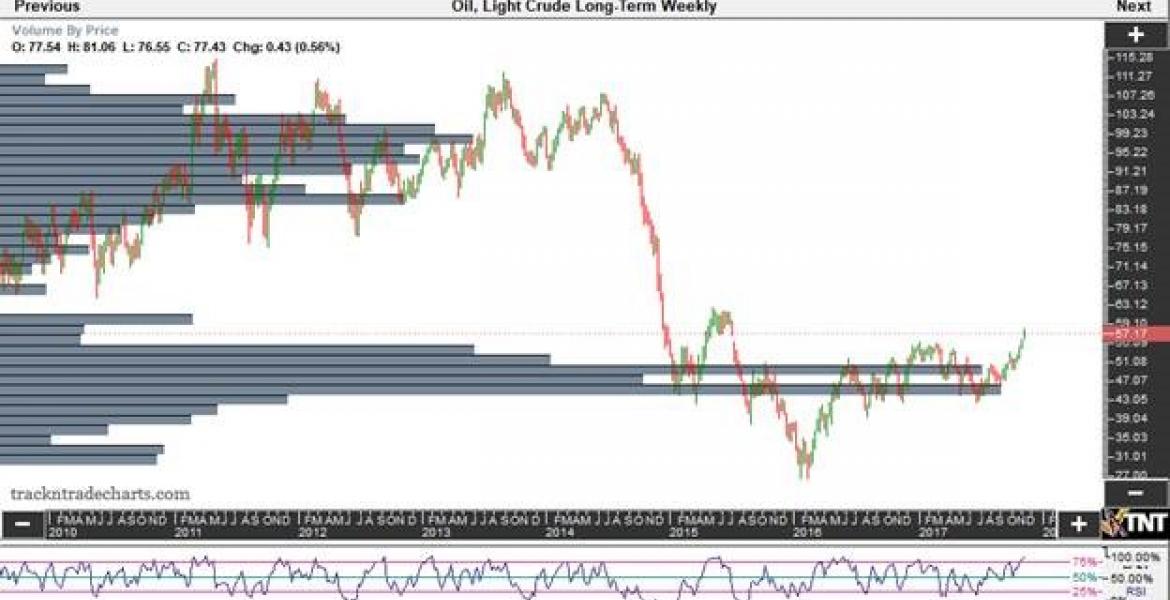
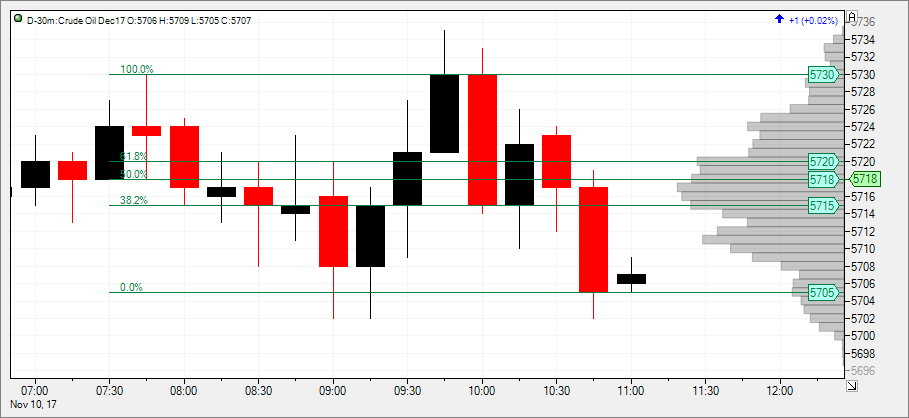
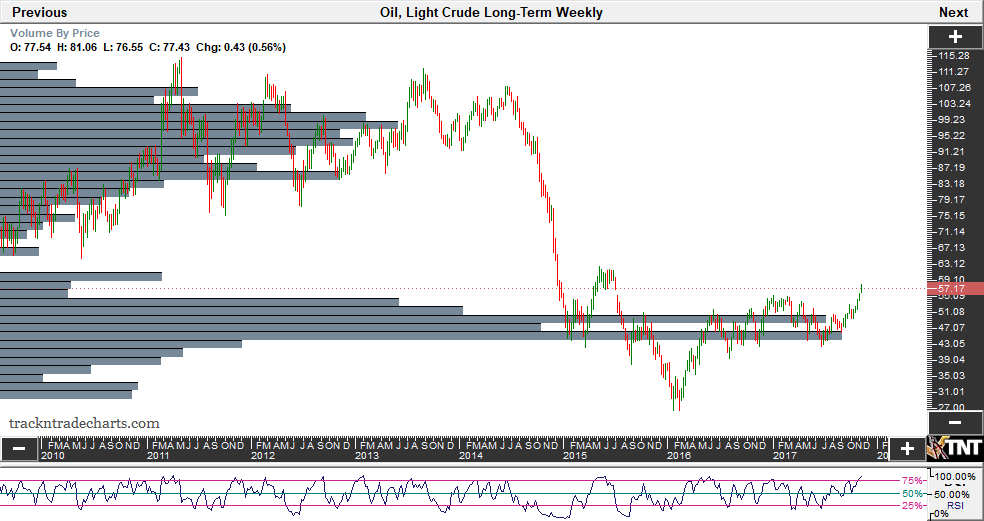
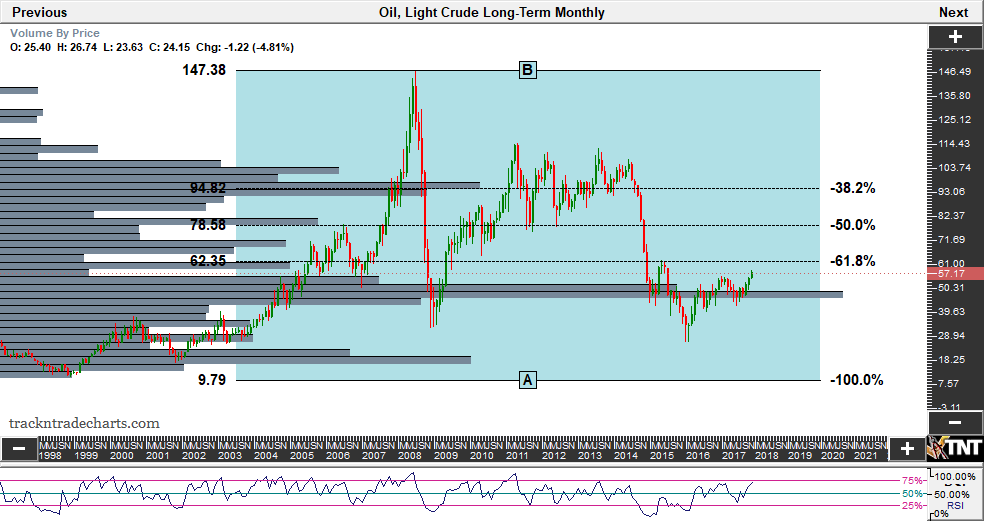
The embedded charts display 30 minute (from 11/10/17), weekly and monthly volume accumulation by price. As price discovery develops between buyers and sellers, volume builds and bell curves form. Mean reversion traders may use the high volume areas as magnets the markets will typically gravitate towards short of anything that may upset the supply/demand of the underlying product. Generally, you will see the high volume area of the bell curve correspond with the inside of the 61.8% and 38.2% fib range. The 30 minute chart of today’s (11/10/17) trade is a good example of an established range/bell curve showing the bulk of the volume between the 57.20 and 57.15 that corresponds to the 38.2% / 61.8% range.
The weekly and monthly charts show the historically strong value areas between 44-54 buyers and sellers have met and created value three times since 2004. There is some room for the upper end of the long term bell curve to fill in value up till about $62 per barrel without needing a major disrupter in the supply/demand.
Developing strong knowledge of intermediate and long term volume by price ranges is helpful for all traders, particularly commercial users of the underlying product. Understanding long term value areas during different environments is not only important to prepare for hedging opportunities but also to help construct an overall business plan that can produce acceptable margins at long term value levels.
CTS T4 Charts – www.ctsfutures.com
Past performance does not guarantee future results.
TrackNTradeCharts.com
Past performance does not guarantee future results
TrackNTradeCharts.com
Past performance does not guarantee future results.
RISK DISCLAIMER: Trading in futures products entails significant risks of loss which must be understood prior to trading and may not be appropriate for all investors. Past performance of actual trades or strategies cited herein is not necessarily indicative of future performance. The information contained herein is provided to you for information only and believed to be drawn from reliable sources but cannot be guaranteed; Phillip Capital Inc. assumes no responsibility for errors or omissions. The views and opinions expressed in this letter are those of the author and do not reflect the views of Phillip Capital Inc. or its staff.