TOCOM July 2019 Market Summary
TOCOM July 2019 Market Summary
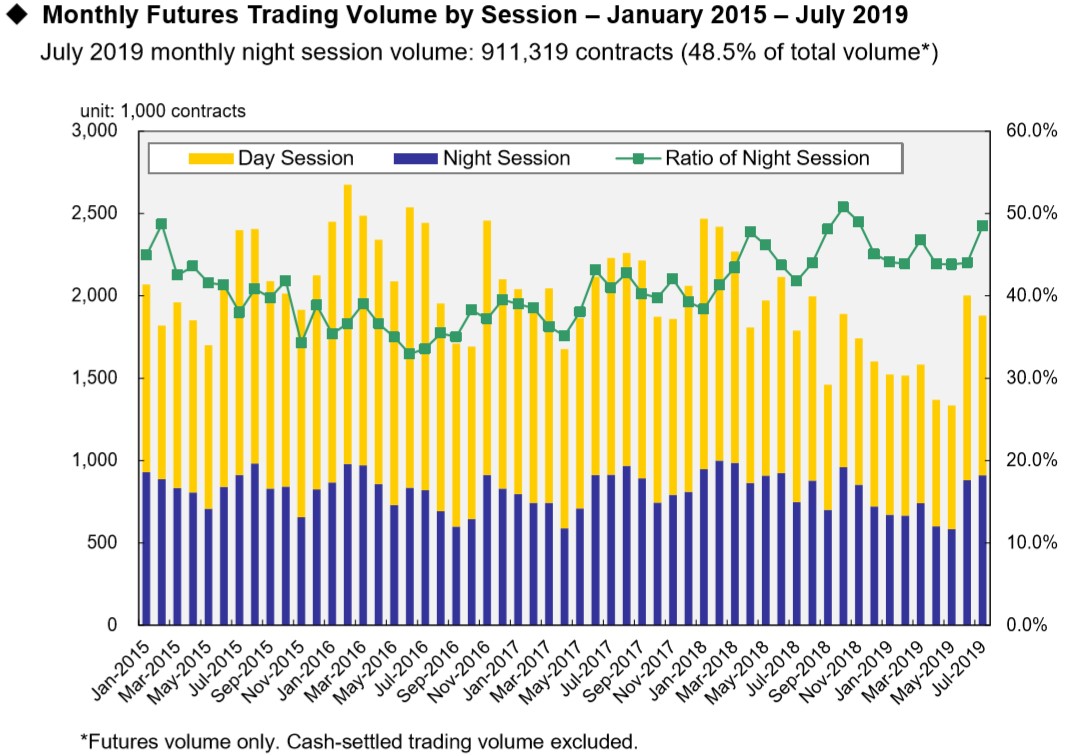
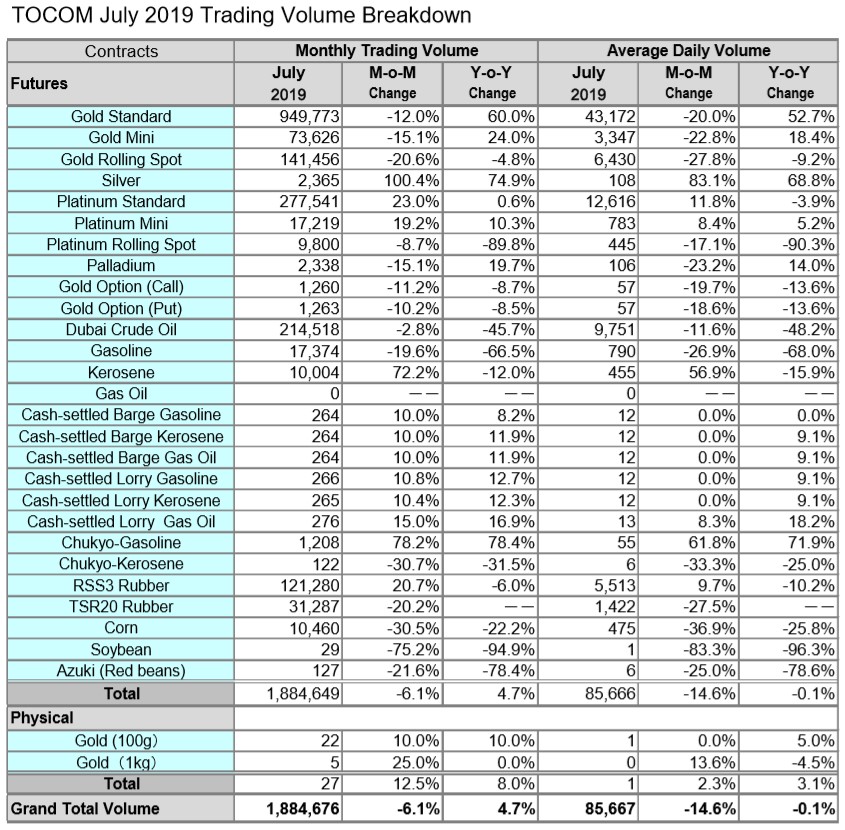
TOCOM July Daily Volume Averaged 85,667 Contracts, Down 14.6% M-o-M
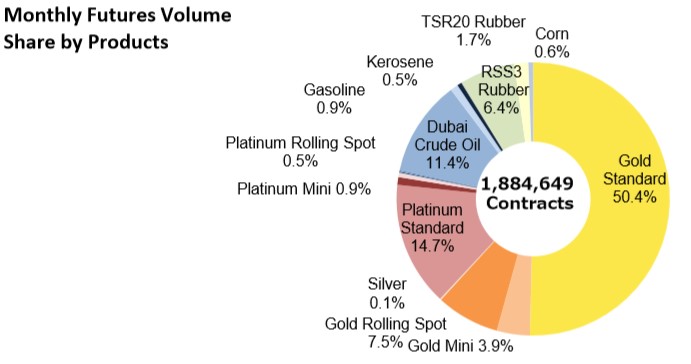
(Tokyo, August 5, 2019 )The Tokyo Commodity Exchange announced today that July 2019 average daily volume was 85,667 contracts, down 14.6% from June and down 0.1% from July 2018. Volume increased for some of TOCOM’s most active contracts, such as Platinum Standard, which grew 11.8% from the prior month to 12,616 contracts, while RSS3 Rubber increased 9.7% to 5,513 contracts. Other contracts saw declines, such as Gold Standard, which was down 20.0% to 43,172, Gold Rolling Spot, which decreased 27.8% to 6,430 and Dubai Crude Oil, which fell 11.6% to 9,751 contracts.
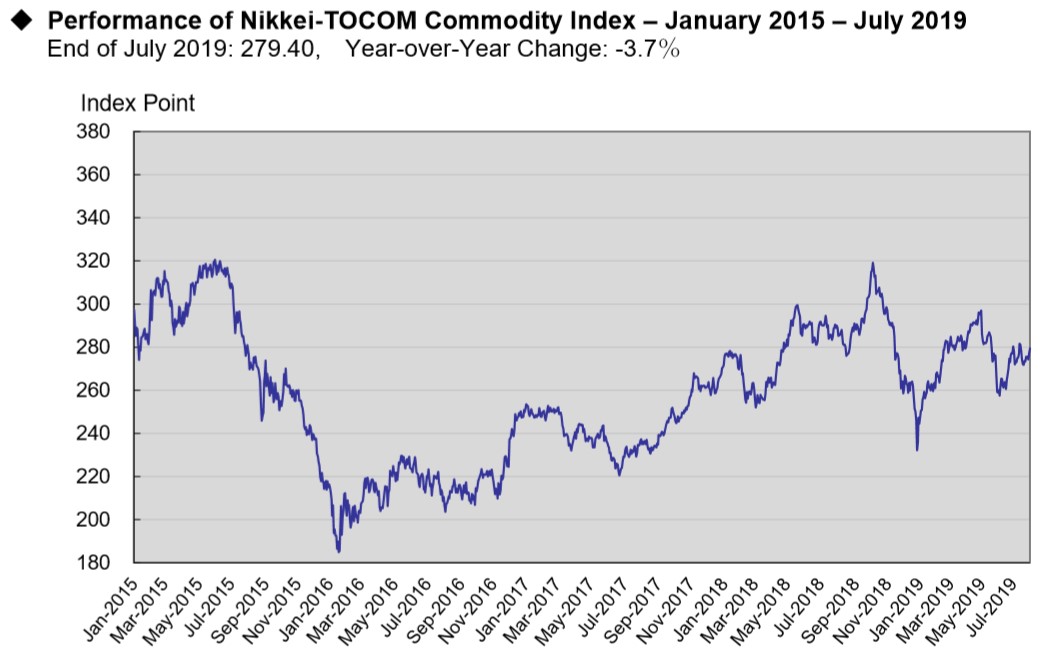
In May, the market was bullish on TOCOM Gold and pushed prices toward 5,000 yen per gram, its highest in more than six years. Expectations for an interest rate cut by the Federal Reserve Bank continued to reflect on the prices, which increased gradually from 4,871 yen per gram at the beginning of the month. The European Central Bank also further eased monetary policy. The low interest rate environment and weak currency markets were the main drivers in the advance in gold prices.
TOCOM Dubai Crude Oil prices remained directionless at around 40,000 yen per kiloliter. An intensifying Iran situation and increased concerns of supply disruption, prices temporarily reached 42,540 yen per kiloliter. When concerns for oversupply returned, prices fell back to 38,020 yen per kiloliter. In the beginning of August, the OPEC-plus group agreed to extend its pact to reduce output through March 2020.
Exchange-wide open interest was 349,825 contracts at month-end, down 5,465 contracts (1.5%) from July 2019.