Chart View: Wrapping Up the Year by Jeff Gilfillan

This segment focuses on what we see in the rear-view mirror. While chart technicians and algo developers may focus on what has happened as near back as the last tick or micro-second, it’s still in the past. We take this data and quickly or slowly make decisions for future trades.
When I write these blogs I know that they won’t be published until all other articles are written, compliance has reviewed them, and marketing has prepared the newsletter – this content, written a few days before Christmas, may be irrelevant by the time it’s published, so my opinions focus on weekly and monthly data. As a result, my viewpoint may not change much from one blog post to the next. This has been the case mostly since the aftermath of the February / March COVID related market stress and the accompanying pullbacks or breakouts.
In April/May, I discussed the massive moves relative to years past post COVID then followed-up in June with opinions on which markets may retrace back to pre-COVID levels and which markets may create new value ranges post COVID. For the last three blogs, I have focused on these value ranges in GC, NQ and CL.
The common theme I see in 2020 among the three heavily traded products is COVID ranges developed consistent daily value from the outset but have yet to build strong weekly and monthly value relative to pre-COVID ranges. Combine unproven long-term value prices with historically large volatility and margins and you get less buy-in.
See current comments below in CME Group GC, NQ and CL.
Happy Holidays!
GOLD
The trend continues to be bullish on LT charts. Last blog, I discussed how a move below 1850 may transition the market to test 1750 value area and the market touched just above that in early Dec. While this long-term value support held, the market needs to build new value above 1950 to get back on track for a move towards LT upside target, which I adjusted to $2400. It’s a trading market between 1550 and 1950 with a slight bias towards an exhaustion move lower.
CME Group – COMEX Gold futures (GC)
LT Value Zone = 1550 – 1580
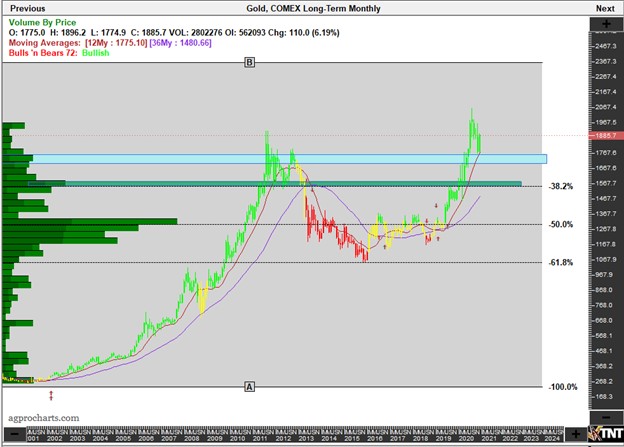
CME Group – CME Gold Futures Continuation Monthly
Chart –< Track N’Trade
Futures trading is not for everyone. The risk of loss in trading can be substantial. Therefore, carefully consider whether such trading is suitable for you in light of your financial condition.
NASDAQ-100
The COVID value ranges were strong, consistent, and swift. The NQ came within 600 points of an upside target I mentioned a few months back. The market appears heavy on the charts across the board. There is COVID range support between 10700-12100 and little intermediate value until 9665 then 6800-7900. Similar to gold, we are in a trading market.
COVID Value range = 10700-12100
First Value Level = 9665
Value Zone = 6800-7900
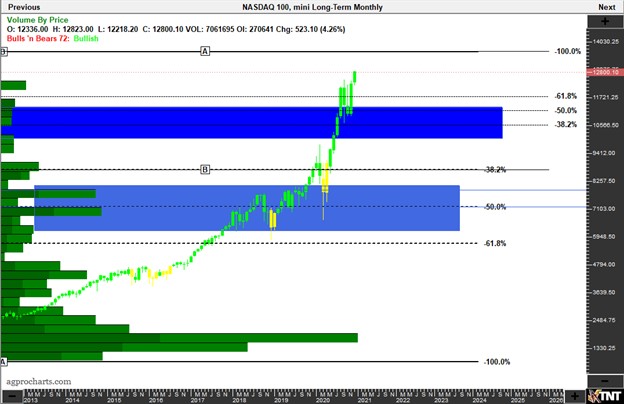
CME Group – E-mini Nasdaq-100 futures (NQ) Continuation Weekly
Chart – Track N’Trade
Futures trading is not for everyone. The risk of loss in trading can be substantial. Therefore, carefully consider whether such trading is suitable for you in light of your financial condition.
CRUDE OIL
CL finally broke into the $45-$55 range mentioned many times as a significant area the market needs to break through and sustain as signs of a return to a pre-COVID demand driven price. The long-term charts are bearish, but there is plenty of upside potential on a sustained trade higher as the shakeout lower should provide enough inertia for massive short covering when and if hedge books come into these value levels between 45-55.
“The CME Group WTI Crude Oil Futures (CL) displays a significant value resistance level on a monthly chart between $45-$55. This is perhaps the strongest indicator the overall market displays between a COVID world and a return to normalcy. This conversation is probably more fundamental than technical, but at least until the world becomes significantly cleaner with energy use, it’s an important chart to watch”.
CME Group - NYMEX WTI Crude Oil futures (CL)
COVID Value range = $17.00 - $23.00
First Value Resistance Level = $45 - $55
Second Value Resistance Level = $70.00
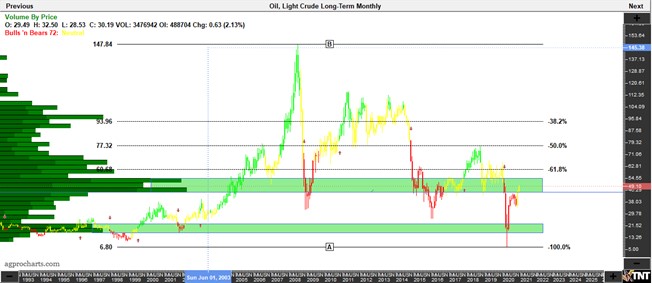
CME Group – NYMEX WTI Crude Oil futures (CL) Monthly Continuation
Chart – Track N’Trade
Futures trading is not for everyone. The risk of loss in trading can be substantial. Therefore, carefully consider whether such trading is suitable for you in light of your financial condition.
Disclaimer: Trading in futures products entails significant risks of loss which must be understood prior to trading and may not be appropriate for all investors. Past performance of actual trades or strategies cited herein is not necessarily indicative of future performance. The information contained herein is provided to you for information only and believed to be drawn from reliable sources but cannot be guaranteed; Phillip Capital Inc. assumes no responsibility for errors or omissions. The views and opinions expressed in this letter are those of the author and do not reflect the views of Phillip Capital Inc. or its staff.