Chart View: Value Areas in the New Norm by Jeff Gilfillan

In previous posts, I discussed the wild swings on the charts and the markets that have begun building new value zones following the COVID-19 outbreak. What is becoming clear is that, at least for the intermediate future, many of the influences behind these moves into new value zones may not change anytime soon.
Where is value support and resistance for the markets potentially building new price levels? I listed chart views of CME E-mini Nasdaq-100, Gold (GC) and WTI Crude Oil (CL) futures below with support and resistance value zones.
The NQ futures were trending higher in low value zones prior to the new normal. Since late February and the V-shaped recovery, a wide range of value has developed from 8327-9733. Smaller value was built just below 10200.
CME gold futures have been trending higher since last Summer. Recent trading has developed strong daily value from just below 1700 to 1744 and then down to 1640.
WTI Crude Oil futures have been trending lower since 2014 on a monthly chart and consolidating within daily and weekly charts. Displayed below are daily, weekly, and monthly charts for WTI futures displaying value resistance zones. The monthly chart shows a strong value zone overhead between $44 and $54 per barrel. The weekly value resistance was largely developed last year between $52 and $59 per barrel, and the daily shows value above between $49 and $52.
Time will tell whether gold and NQ futures will continue to build value and form a new bell- shaped curve or whether this stage is primarily speculative and will run out of steam. The WTI futures chased a good part of the speculative trade away in April, but the charts will tell us if the demand component will be affected enough to influence prices back to zones largely developed decades ago.
DISCLAIMER: Trading in futures products entails significant risks of loss which must be understood prior to trading and may not be appropriate for all investors. Past performance of actual trades or strategies cited herein is not necessarily indicative of future performance. The information contained herein is provided to you for information only and believed to be drawn from reliable sources but cannot be guaranteed; Phillip Capital Inc. assumes no responsibility for errors or omissions. The views and opinions expressed in this letter are those of the author and do not reflect the views of Phillip Capital Inc. or its staff.
E-mini Nasdaq-100 futures (NQ)
First Value Level = 10196 - 10187
Value Zone = 8327.25 - 9733.50
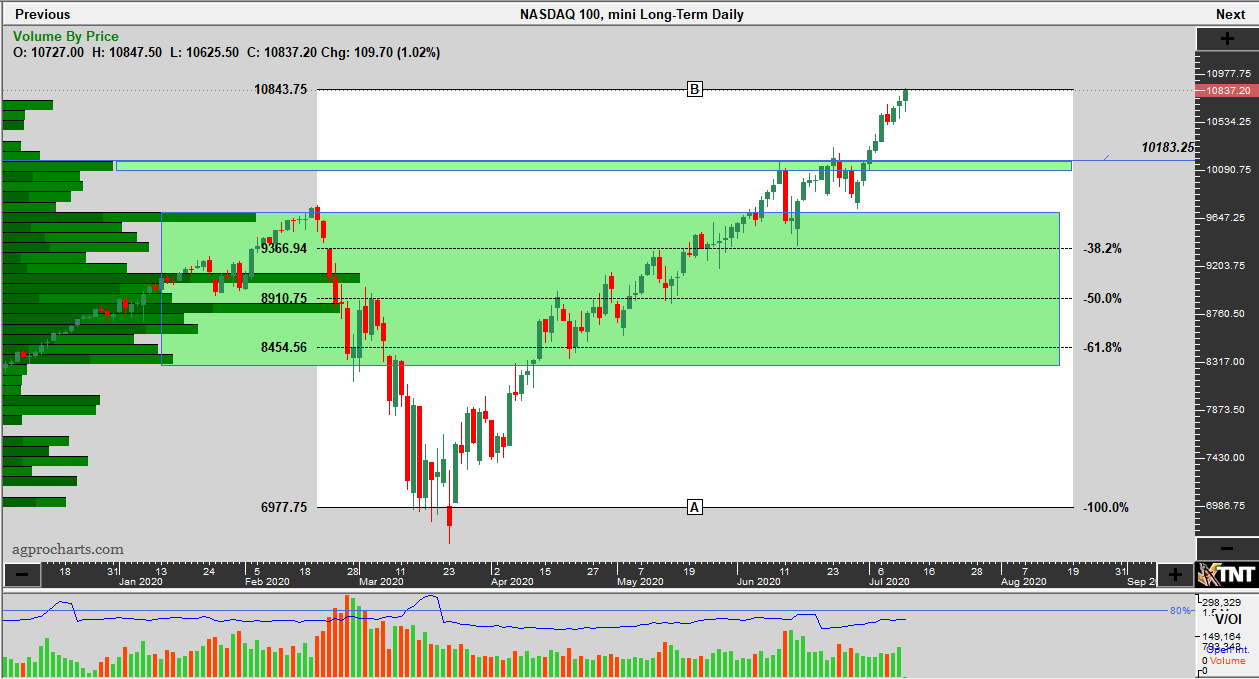
CME Group – E-mini Nasdaq-100 futures (NQ) Continuation Daily
Chart – Track N’Trade
Futures trading is not for everyone. The risk of loss in trading can be substantial. Therefore, carefully consider whether such trading is suitable for you in light of your financial condition.
CME Group – COMEX Gold futures (GC)
First Value Level = 1698.30 – 1744.80
Value Zone = 1637.20 – 1645.90
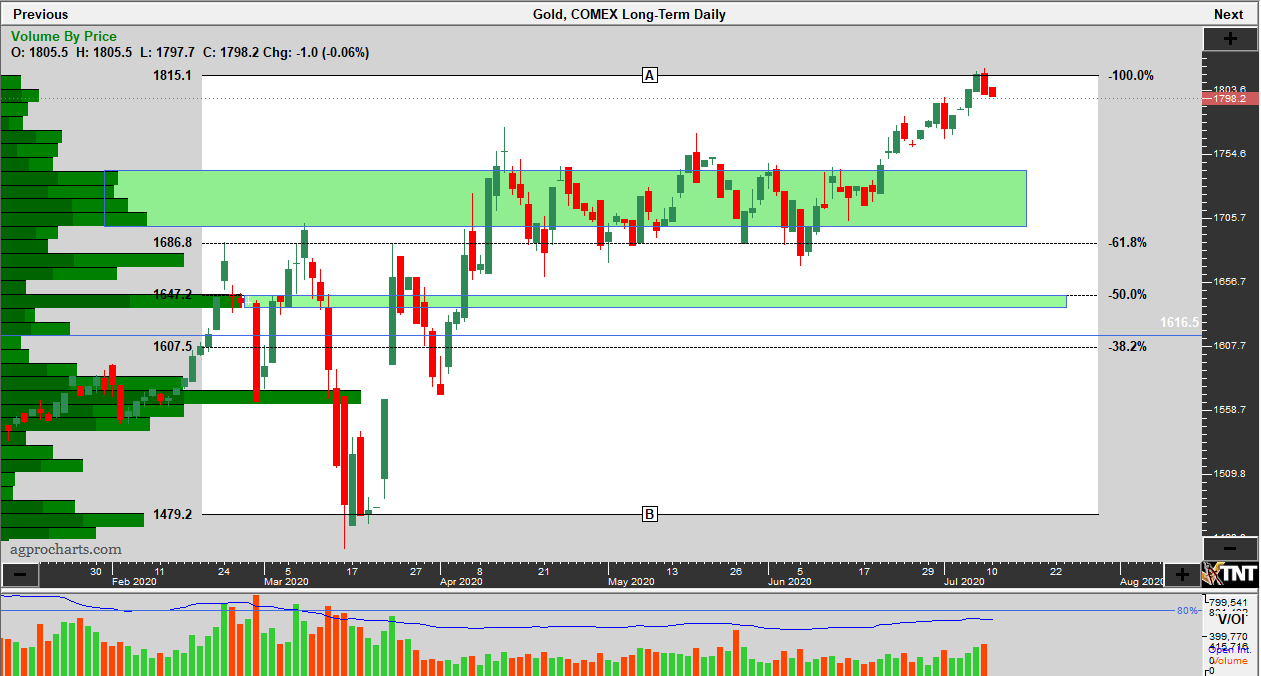
CME Group – CME Gold Futures Continuation Daily
Chart – Track N’Trade
Futures trading is not for everyone. The risk of loss in trading can be substantial. Therefore, carefully consider whether such trading is suitable for you in light of your financial condition.
CME Group - NYMEX WTI Crude Oil futures (CL)
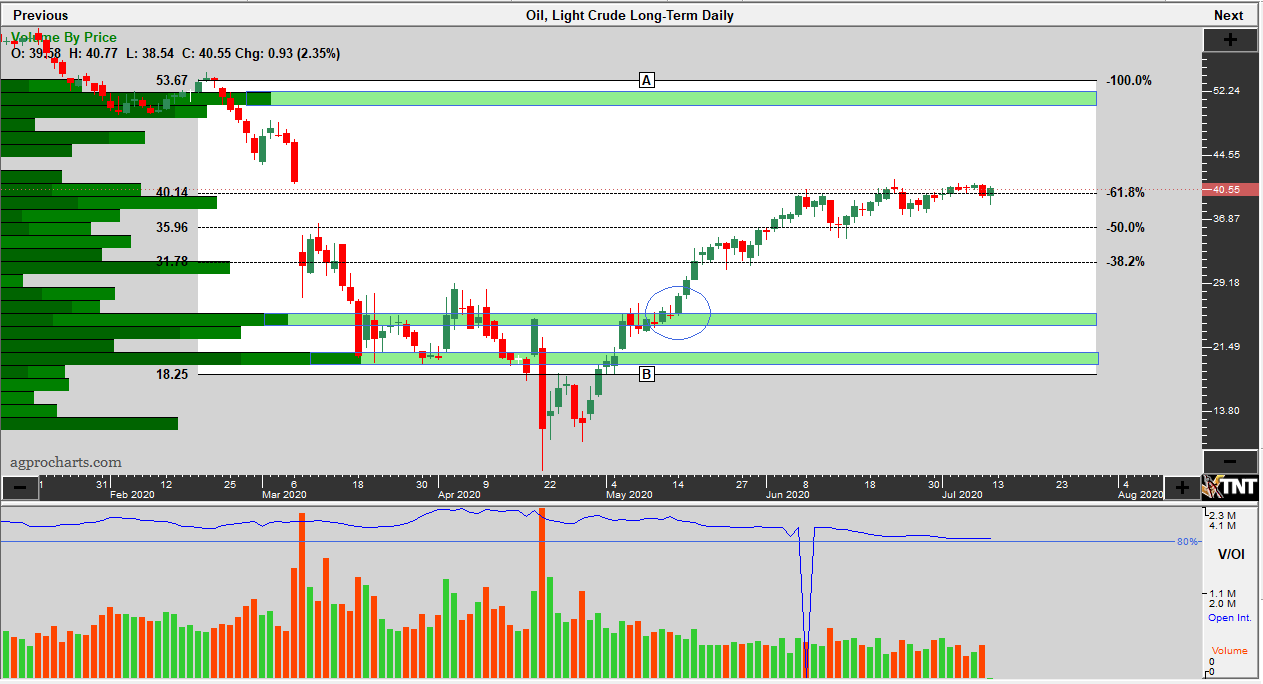
CME Group – NYMEX WTI Crude Oil futures (CL) Daily Continuation
Chart – Track N’Trade
Futures trading is not for everyone. The risk of loss in trading can be substantial. Therefore, carefully consider whether such trading is suitable for you in light of your financial condition.
CME Group - NYMEX WTI Crude Oil futures (CL)
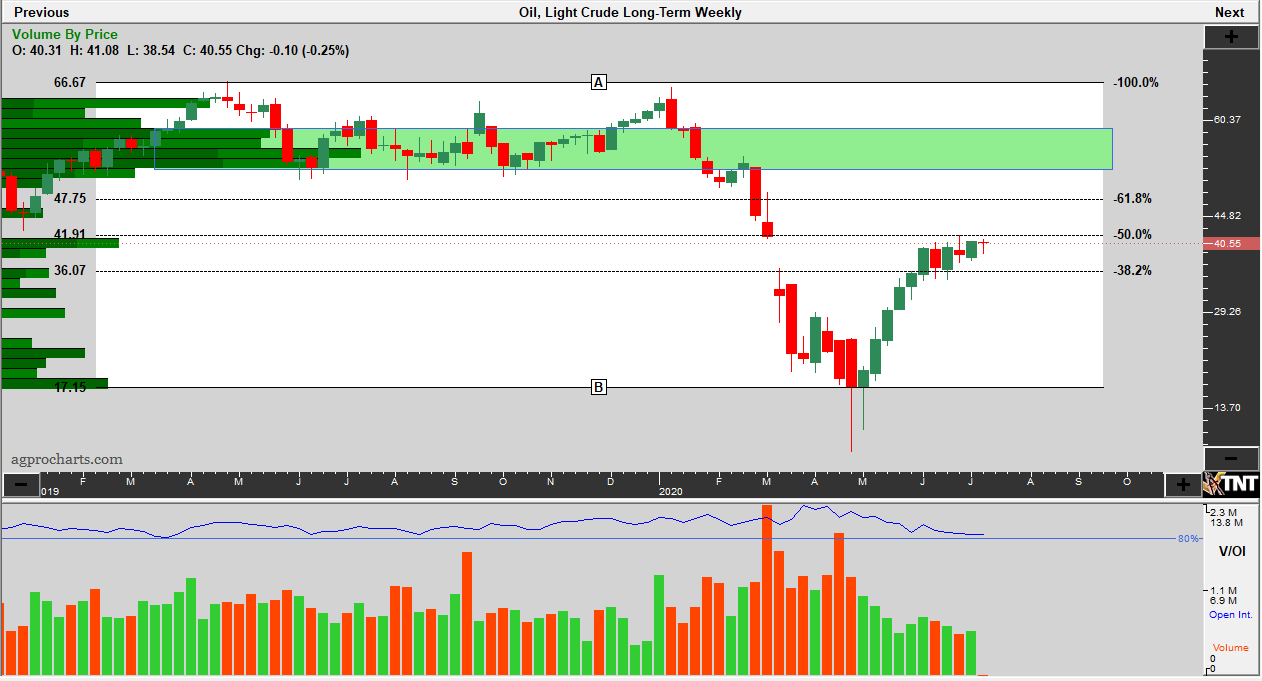
CME Group – NYMEX WTI Crude Oil futures (CL) Weekly Continuation
Chart – Track N’Trade
Futures trading is not for everyone. The risk of loss in trading can be substantial. Therefore, carefully consider whether such trading is suitable for you in light of your financial condition.
CME Group - NYMEX WTI Crude Oil futures (CL)
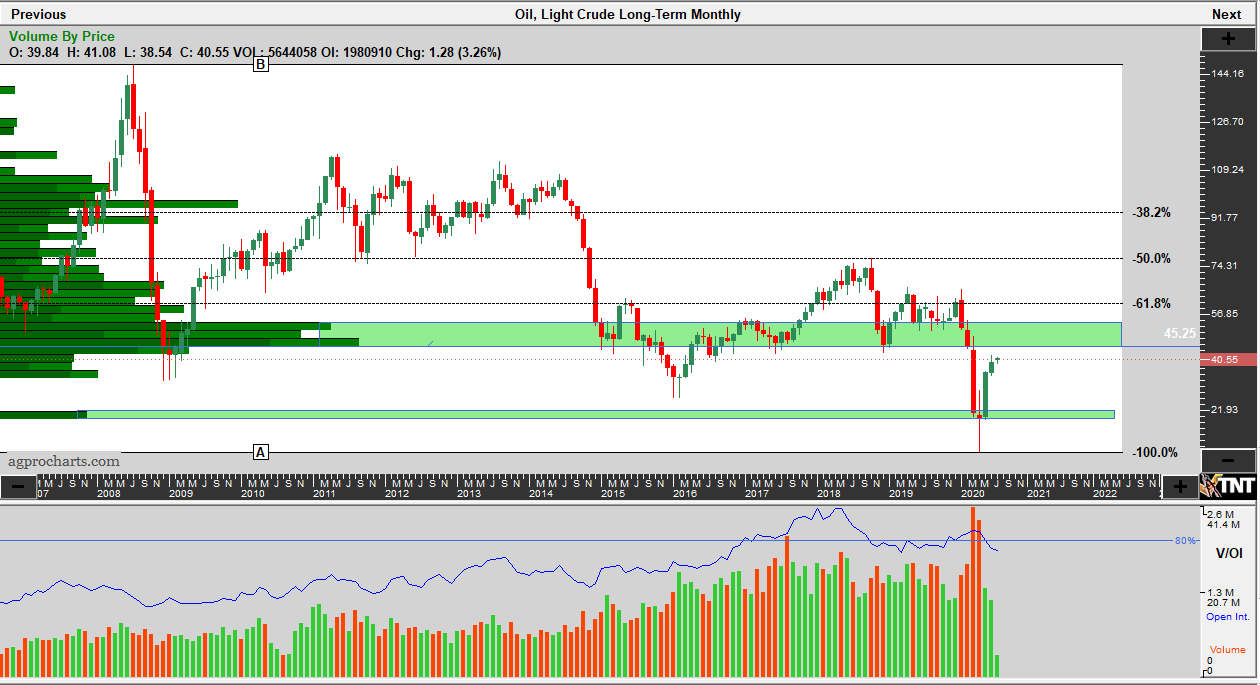
CME Group – NYMEX WTI Crude Oil futures (CL) Monthly Continuation
Chart – Track N’Trade
Futures trading is not for everyone. The risk of loss in trading can be substantial. Therefore, carefully consider whether such trading is suitable for you in light of your financial condition.