THE CHARTIST VIEW - Gold Bugs' Ten Year Roller Coaster
by Jeff Gilfillan
Past performance does not guarantee future results.
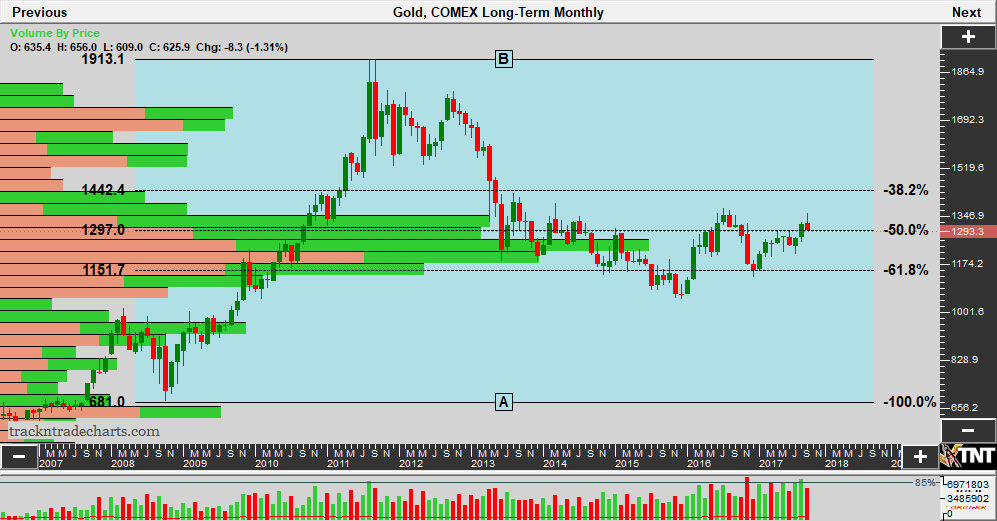
Monthly continuation gold futures have failed to break 36 month highs since contract highs (1911.60) were set in September 2011. Since the $400+ collapse from April to June of 2013, the futures market has built an impressive bell curve on the volume by price chart over the last 4 years with the exception of a 7 month washout that touched just above the base built in 2008-2009 during the onset of the financial crisis. This sideways channel from 1350 to 1135 has spent a good deal of time straddling the 10 year 50% retracement level at the 1296 area. Further, since the surprise Brexit in June 2016 and beyond monthly volume has been historically elevated.
Have the lower lows, sideways channel and 2015 washout worn out the gold bugs? Commitment of Traders reports suggest this is an on again off again love affair and the open interest history shows little signs of weakening. Be eyeful of the how the market holds support against the top of the LT value line at 1265 and August front month low of 1251.40. You can also interpret an Elliott Wave move down to 1150-75 as being part of a wave D going back to October 2015 lows before a possible resumption of a move higher (wave E). Long-term squeeze areas are low volume caverns just below the 2011-2013 range around 1500 and just below 2015 lows around 1025.
Interest in trading gold through centrally cleared futures exchanges has expanded since the financial crisis. CME Group and TOCOM handle a great deal of global exchange traded gold futures along with several Asian exchanges including but not limited to Dubai (DGCX), Hong Kong (HKEX), India (MCX), Indonesia (ICDX), Thailand (TFEX), Malaysia (BURSA), Turkey (Borsa Istanbul), China (SGE) and Singapore (SMX). ICE US and LME also offer gold futures.
The above chart in many ways is indicative of nearly 10 years of global financial healing and historical market participation of central banks. The recent build-up in average monthly volume may suggest the consolidating market may be due for a move away from this value zone (1135-1350). Traders should understand the different contract types, sizes, storage locations and currencies that exchange traded gold futures offer globally to maintain the best liquidity and potentially benefit from arbitrage opportunities.
RISK DISCLAIMER: Trading in futures products entails significant risks of loss which must be understood prior to trading and may not be appropriate for all investors. Past performance of actual trades or strategies cited herein is not necessarily indicative of future performance. The information contained herein is provided to you for information only and believed to be drawn from reliable sources but cannot be guaranteed; Phillip Capital Inc. assumes no responsibility for errors or omissions. The views and opinions expressed in this letter are those of the author and do not reflect the views of Phillip Capital Inc. or its staff.