CHART VIEW: CME Group Lean Hog Futures by Jeff Gilfillan
Lean Hog futures rallied nearly 75% in front month contracts from late February until last week’s 91.225 intraday high on 04/16. The board filled a daily gap and created a weekly gap at 81.75.
Last week’s high met the top end of a long term value area (41.60 – 91.60) and a 61.8% Fib area (90.72) dating back to 1971. The high also is testing the 50%-61.8% fib area of the Jan 2011 – Jan 2014 price range. A small retracement may test the 38.2% price point at 84.85 of the 2011-2014 range.
To the upside, the obvious washout level would be a temporary break of the 92.825 intraday chart high from July 2017. A continued move higher will find value from 94 to 96 with a long term washout point from 104-106.
Fundamentals aside, current levels have been tested twice (2016 and 2017) since the 2014 rally and many times the third test breaks into new value areas. A failure of the current breakout higher, however, may re-establish new support levels between 72-77 vs. the sub 68 cent range experienced since last July.
Phillip Capital Agribusiness Clearing
Phillip Capital Inc. offers full-service risk management brokerage through our IB network and direct clearing for agribusiness hedging operations.
Keep up to speed with mobile news and market commentaries in grains/soy, meats, metals, energies, softs, financials & weather using Phillip Capital Market Center. Download QT Quotes on your phone and email sales@phillipcapital.com for a username/password.
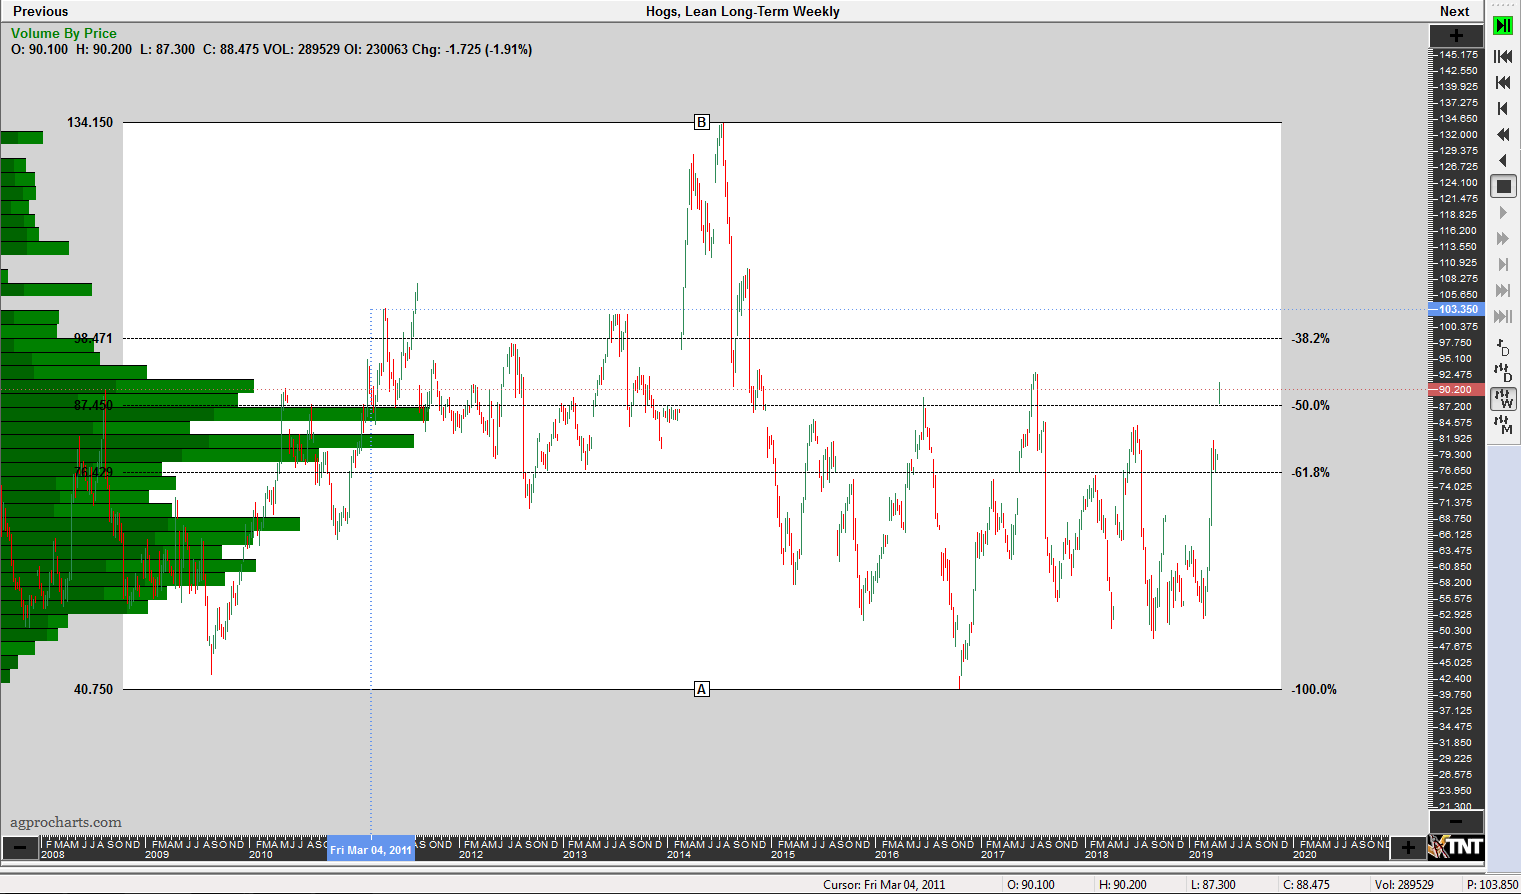
CME Group – CME Lean Hog Futures Continuation Weekly
Chart – Track N’Trade
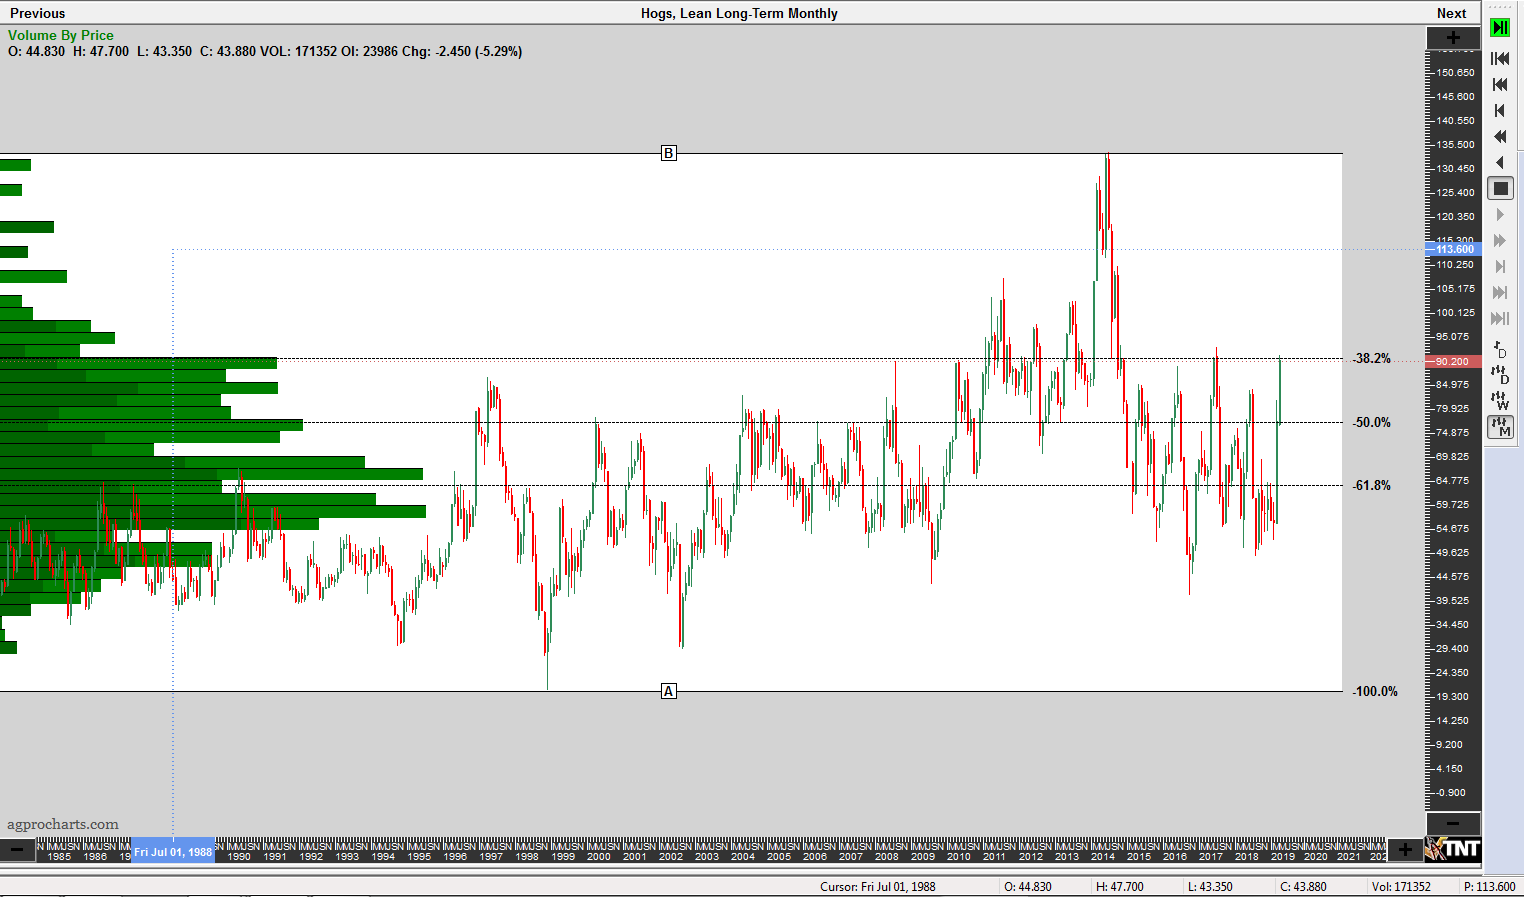
CME Group – CME Lean Hog Futures Continuation Monthly
Chart: Track N’Trade