CHART VIEW – Gold Futures
Written by Jeff Gilfillan
CME COMEX Gold futures failed to breakout of its consolidated strong value range in place since 2013 despite a sustained effort through the 1st and a good part of the second quarter of 2018. This range visible on the monthly continuation chart below spans from roughly 1212 to 1350 in front month gold futures. From a technical perspective this discounts the strength of support at recent 1210 level.
The 2016 high and low on a monthly chart serve as parameters for the current price point range between 1374.90 and 1123.90 in the front month contract. Short-term resistance should start at Dec 2017 low at 1236.50 then long-term 50% level on a continuation chart at 1296.
There is only so much you can analyze in a choppy market range, however, consolidation offers low volatility opportunities in options.
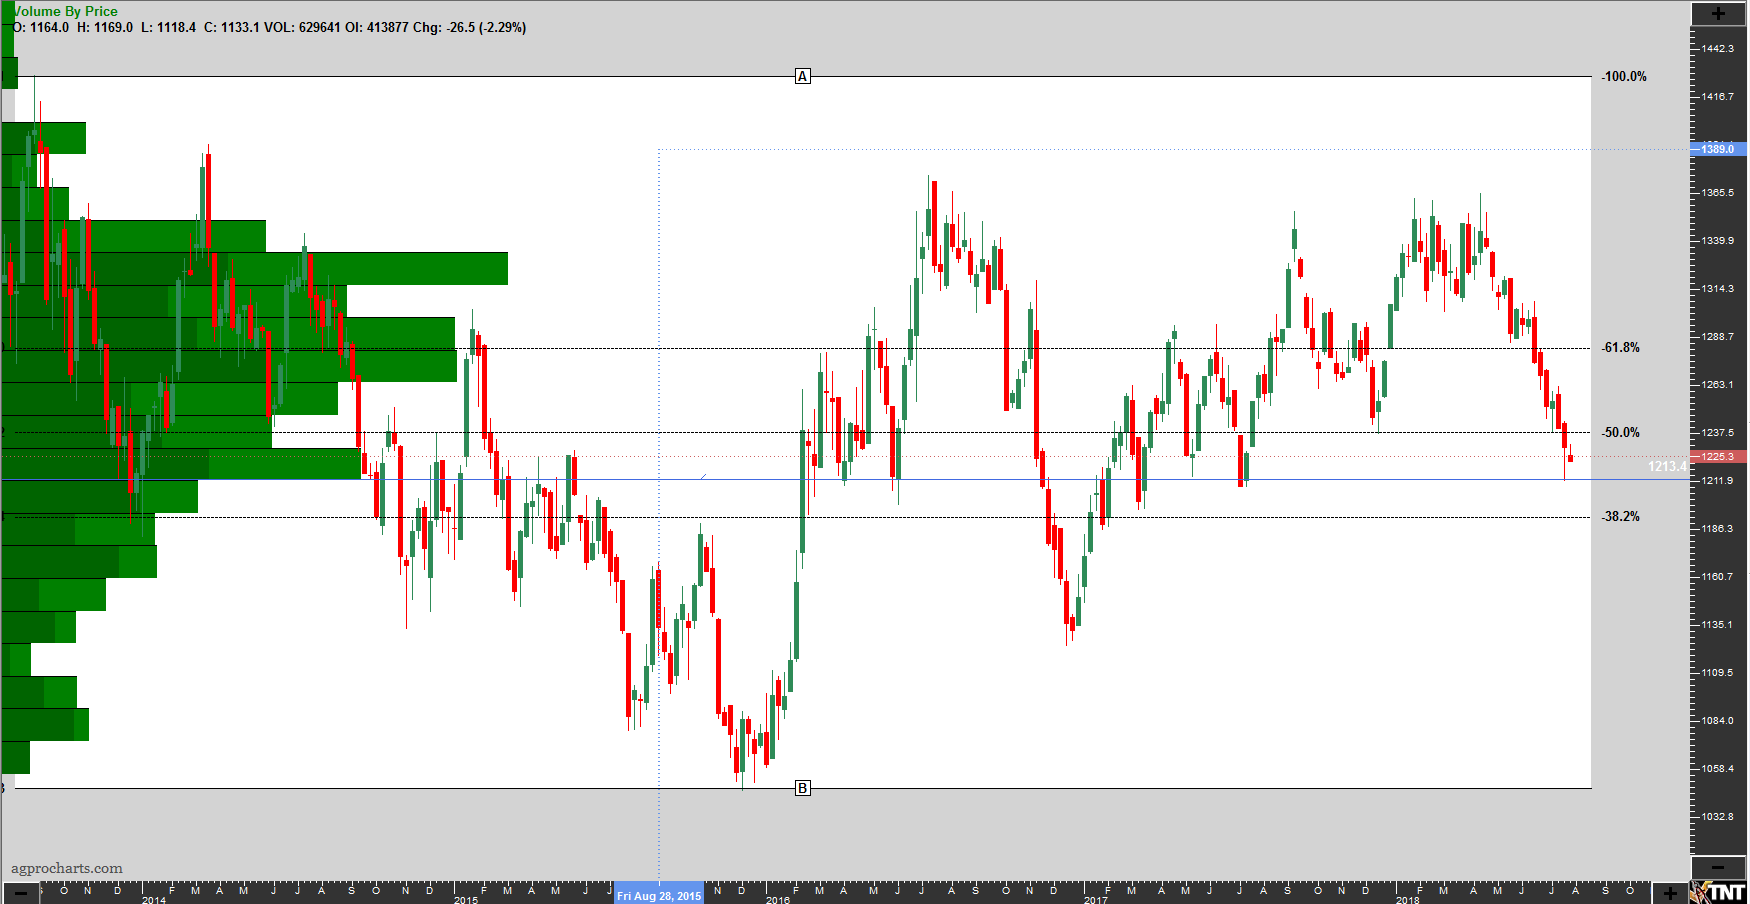
CME Group – GC – WEEKLY – GOLD COMEX (Globex)
Chart – Track’NTrade
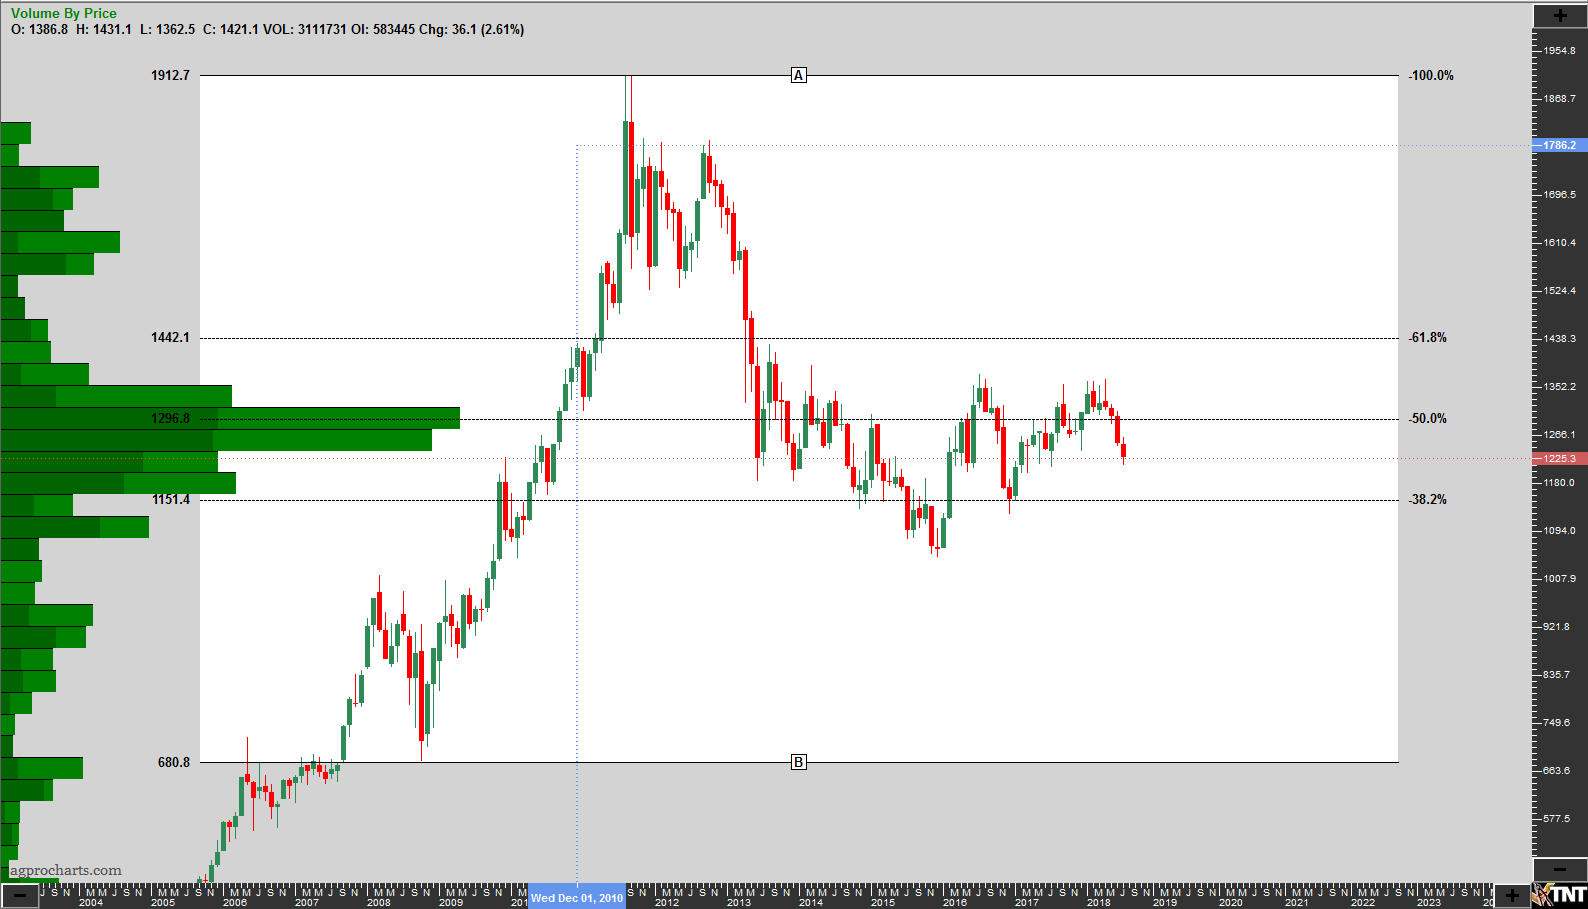
CME Group – GC – MONTHLY – GOLD COMEX (Globex)
Chart – Track’NTrade
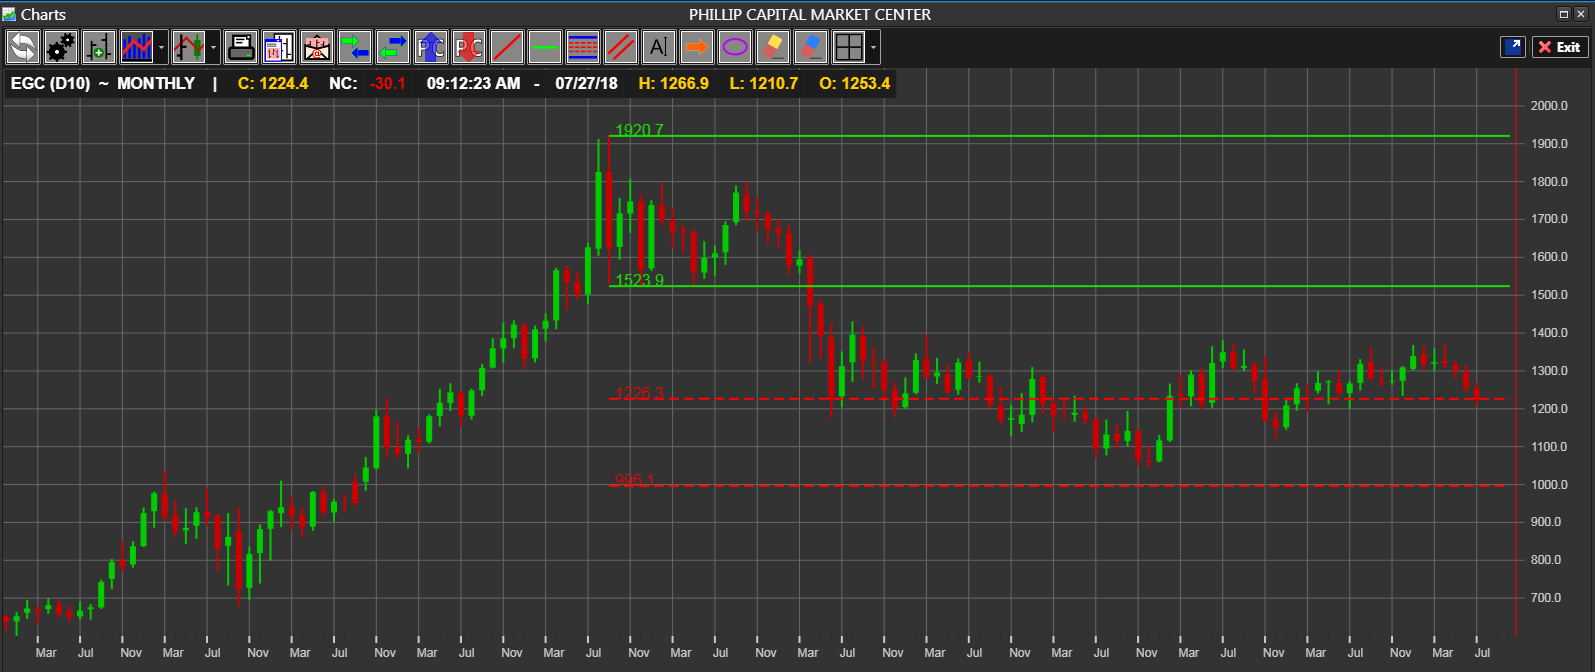
CME Group – GC – MONTHLY – GOLD COMEX (Globex)
Chart – PHILLIP CAPITAL MARKET CENTER
RISK DISCLAIMER: Trading in futures products entails significant risks of loss which must be understood prior to trading and may not be appropriate for all investors. Past performance of actual trades or strategies cited herein is not necessarily indicative of future performance. The information contained herein is provided to you for information only and believed to be drawn from reliable sources but cannot be guaranteed; Phillip Capital Inc. assumes no responsibility for errors or omissions. The views and opinions expressed in this letter are those of the author and do not reflect the views of Phillip Capital Inc. or its staff.