CHART VIEW – Interest Rates by Jeff Gilfillan
Interest rate futures charts continue to build support following the base set in the aftermath of the early February volatility squeeze. As noted last month, long term support in front-month futures is down at 142’20 and 141’10 (the market hit a low of 142’30 since this newsletter was posted last on 03/21). I indicated targets at 145, 146 and 148. The 148 level is still in play.
The TNX (CBOE Interest Rate 10 Year Note) dipped down to a low of 2.72. I still believe the 2.62-2.68 needs to be tested and possibly breached momentarily to continue to squeeze out the newer weak longs that are part of the gap range higher rounding top range created a little less than a week prior to the early February equity market collapse and volatility squeeze.
A look at the monthly charts for the 10 year rate is a bit frightening to say the least. There is an element of “Murphy’s Law” as it relates to market analyst’s thoughts about higher rates. This is a technical piece, so I’ll stop there. When the TNX washout is over, keep a close eye on the 3.00-3.05 level in the TNX.
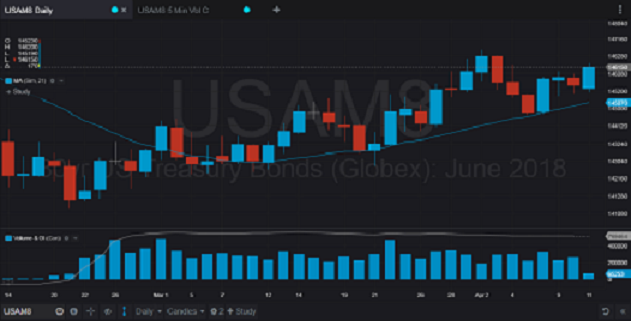
CME Group – USAM8 – DAILY – 30yr US Treasury Bonds (Globex)
CHART - CQG Desktop – Next Generation Trading and Data Visualization
Futures trading is not for everyone. The risk of loss in trading can be substantial. Therefore, carefully consider whether such trading is suitable for you in light of your financial condition.
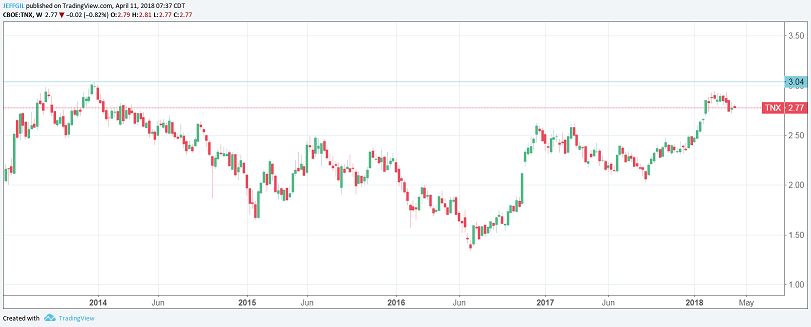
CBOE – INTEREST RATE 10 YEAR T NOTE: TNX, Monthly Chart
Chart – TradingView.com
Futures trading is not for everyone. The risk of loss in trading can be substantial. Therefore, carefully consider whether such trading is suitable for you in light of your financial condition.