CHART VIEW – E-mini S&P 500 Futures
By Jeff Gilfillan
The systematic selloff in the ES that started 2 weeks ago is a healthy reminder that a strong bull market is not sustainable without tests or corrections. While an official correction by definition in the ES on a closing basis has not occurred yet, the intraday move was over 10% from high to low.
As of this writing (Wednesday - 02/07), the difference between the closing prices of the March 2018 ES within the current range is 254.25 points (H 2874.75 L 2620.50). The 50% area is at 2747. This area (2747) will serve as the first area of short term value resistance. The second target would be around 2820. It is not unusual for a market in the wake of a selloff to swiftly correct and retest the upper range before backing down.
A larger correction lower in the intermediate term has a large area to backfill between 2130 and 2500 (see chart below). If a correction does materialize, the first value area target is 2500; LT washout area is between 2280-2300; LT value support is 2134. The meltdown figures are 1700 as a washout area and 1580 as the 3rd area of long term value.
When markets correct it takes time for reality to sink in even if the charts are as heavy as they are now. Volatility has returned and should continue while the market finds the path of least resistance. Look for the market to attract buyers this week. The longer the market sustains over 2500 and builds value the stronger the case is for new buyers to get on the boat and return to new highs
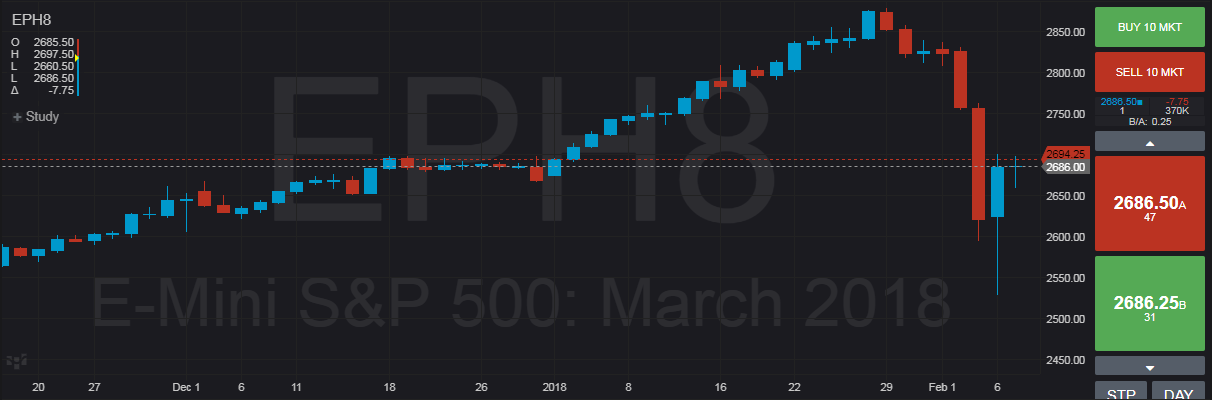
CHART - CQG Desktop – Next Generation Trading and Data Visualization
Past performance does not guarantee future results.
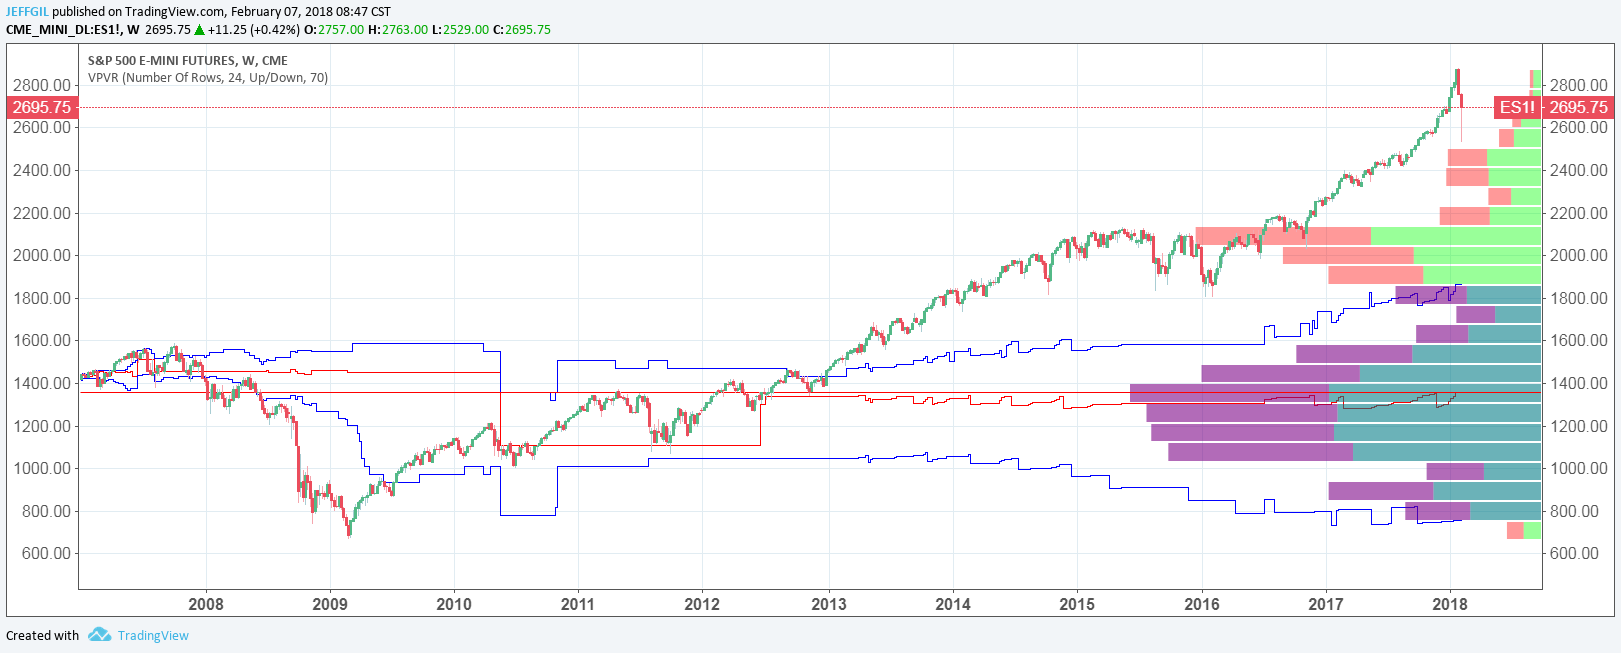
Chart – TradingView.com
Past performance does not guarantee future results.
RISK DISCLAIMER: Trading in futures products entails significant risks of loss which must be understood prior to trading and may not be appropriate for all investors. Past performance of actual trades or strategies cited herein is not necessarily indicative of future performance. The information contained herein is provided to you for information only and believed to be drawn from reliable sources but cannot be guaranteed; Phillip Capital Inc. assumes no responsibility for errors or omissions. The views and opinions expressed in this letter are those of the author and do not necessarily reflect the views of Phillip Capital Inc. or its staff.