Market Related Events and the Dramatic Effect on the VIX Curve
By CFE:
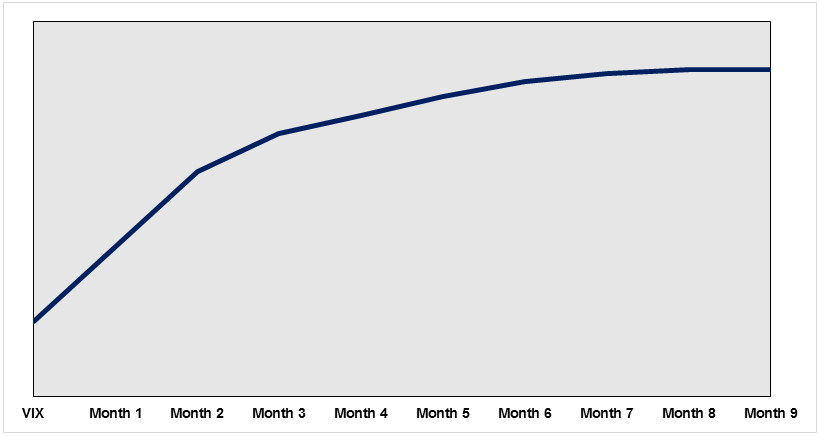
Many traders focus on the relationship between spot VIX and the actively traded VIX futures contracts. The chart of these relationships is often referred to as the VIX Term Structure. More often than not, the VIX Term Structure consists of spot VIX at a discount to the near month futures with each farther dated futures contract at a premium to the previous contract. The curve usually looks like the shape below which is referred to as being in contango.
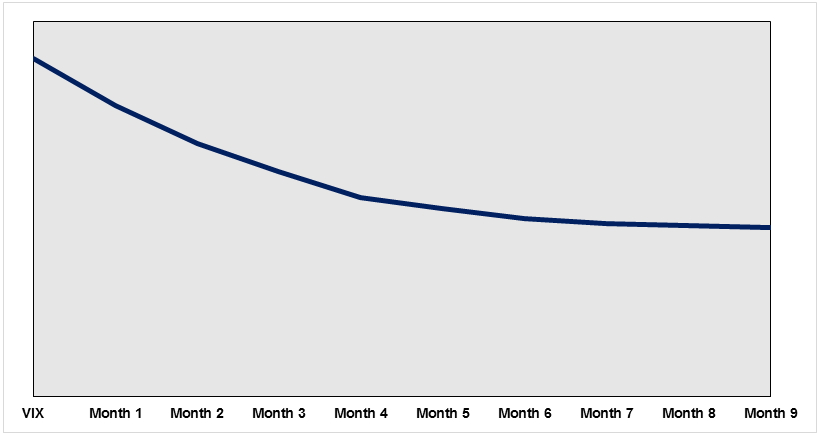
During periods of higher volatility as indicated by a quick rise in VIX, the shape of the curve often shifts to a shape where spot VIX is higher than the near dated futures contract and as the expiration dates move farther out the price of the VIX futures contracts is lower. The common term for this is backwardation and a generic example of this appears below.
Due to the dynamic nature of the relationship between VIX futures pricing, spread trading the different expirations has become a very popular method of speculating on the direction of volatility. The near dated future is often more responsive to the price change in the spot index. Traders may take a directional position with a near dated contract and the take an offsetting position in a longer dated contract. The motivation may also an expectation of a move where the spread between two of the VIX futures contacts either widens or narrows. Finally, traders may take a position when one expiration is higher than another expiration with the expectation that the relationship will flips with the contract at a premium dropping to a discount.
Over the past few months there have been some market related events that have had a dramatic andquick impact on the shape of the VIX curve. One notable event was the surprise election results in Britain. The market reaction to Brexit offers examples of instances where traders may have profited from the near month moving up more than the second month contract as well as the near month moving down more than the second month.
An interesting move in the curve occurred in reaction to the referendum commonly referred to as
Brexit. The market consensus was that the vote would be close, but the citizens of Britain would vote to remain as part of the European Union. We are all aware the result was quite different. The chart below shows VIX and associated futures pricing from the US market closing on June 23rd and in the prestandard market hours the morning after the results were known.
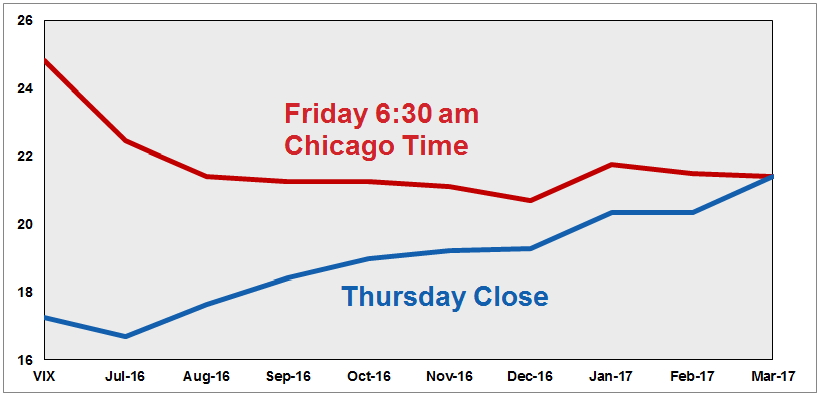
A trader who wanted to speculate that volatility would rise in reaction to the Brexit referendum may
have considered purchasing the July VIX futures and selling the August contract. Both rose in reaction to Brexit but the July VIX outperformed August by about two points. Keep in mind if this trader had been wrong about the move in volatility that followed Brexit the VIX curve would have moved lower and the gain from the short August contract would have offset some of the losses in the July contract.
Sticking with the Brexit example, note the price behavior on the chart below. The blue line shows the VIX term structured on the market close the day after the market absorbed the Brexit news and the curve one week later.
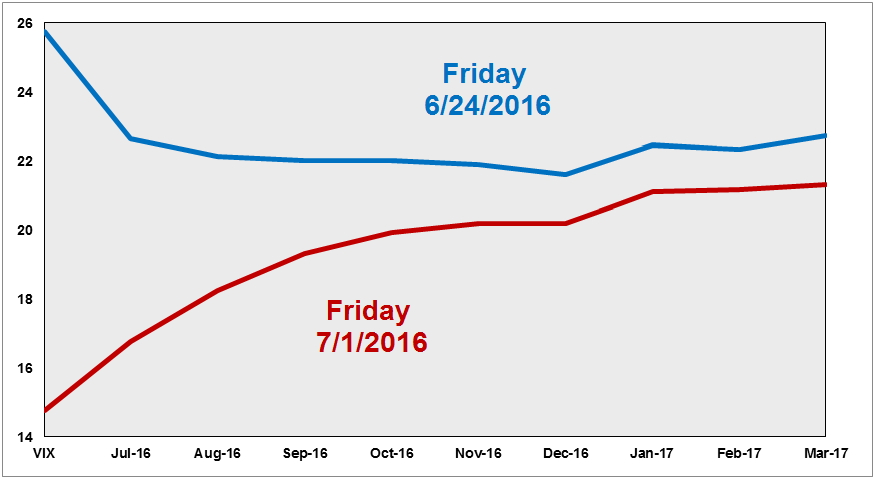
As equity markets around the world rebounded from the initial drop related to Brexit volatility moved down as well. The curve moved from backwardation to contango and the July VIX contract dropped about six points while August VIX was down four points. The result would have benefitted a trader who sold July and went long August. Again, if the outlook for lower volatility had been wrong a trader would have been hurt by a short position in the July contract, but some of those losses would be offset through owning August VIX.
Trading different VIX futures against each other has become a very popular method of speculating on the direction of volatility. The risk of being on the wrong side of a move is reduced, but the ability to profit from the changing relationship between different contract pricing still exists. To learn more about VIX and VIX futures trading visit www.cfe.cboe.com.
RISK DISCLAIMER: Trading in futures products entails significant risks of loss which must be understood prior to trading and may not be appropriate for all investors. Past performance of actual trades or strategies cited herein is not necessarily indicative of future performance. The information contained herein is provided to you for information only and believed to be drawn from reliable sources but cannot be guaranteed; Phillip Capital Inc. assumes no responsibility for errors or omissions. The views and opinions expressed in this letter are those of the author and do not reflect the views of Phillip Capital Inc. or its staff.